The Solar Energetic Particle Ionic Charge Analyzer (SEPICA) and the Data Processing Unit (S3DPU) for SWICS, SWIMS and SEPICA
E. Möbius1, D. Hovestadt2, B. Klecker2, L.M. Kistler1, M.A. Popecki1, K.N. Crocker1, F. Gliem3, M. Granoff1, S. Turco1, A. Anderson1, H. Arbinger2, S. Battell5, J. Cravens6, P. Demain1, J. Distelbrink1, I. Dors1, P. Dunphy1, S. Ellis1, J. Gaidos1, J. Googins1, A. Harasim4, R. Hayes1, G. Humphrey1, H. Kästle1, 2, E. Künneth2, J. Lavasseur1, E.J. Lund1, R. Miller1, G. Murphy7, E. Pfeffermann2, K.-U. Reiche3, E. Sartori1, J. Schimpfle4, E. Seidenschwang2, M. Shappirio1, K. Stöckner3, S.C. Taylor1, P. Vachon1, M. Vosbury1, W. Wiewesiek3, V. Ye1
Abstract
The Solar Energetic Particle Ionic Charge Analyzer (SEPICA) is the main instrument on the Advanced Composition Explorer (ACE) to determine the ionic charge states of solar and interplanetary energetic particles in the energy range from  0.2 MeV/nucleon to 5 MeV/charge. The charge state of energetic ions contains key information to unravel source temperatures, acceleration, fractionation and transport processes for these particle populations. SEPICA will have the ability to resolve individual charge states and have a substantially larger geometric factor than its predecessor ULEZEQ on ISEE-1 and -3, on which SEPICA is based. To achieve these two requirements at the same time, SEPICA is composed of one high charge resolution sensor section and two low charge resolution, but large geometric factor sections. The charge resolution is achieved by focusing of the incoming ions through a multi-slit mechanical collimator, deflection in an electrostatic analyzer with a voltage up to 30 kV, and measurement of the impact position in the detector system. To determine the nuclear charge (element) and energy of the incoming ions the combination of thin-window flow-through proportional counters with isobutane as counter gas and ion implanted solid state detectors provide for 3 independent
  E (energy loss) versus E (residual energy) telescopes. The multi-wire proportional counter simultaneously determines the energy loss E and the impact position of the ions. Suppression of background from penetrating cosmic radiation is provided by an anti-coincidence system with a CsI scintillator and Si-photodiodes. The data are compressed and formatted in a data processing unit (S3DPU) that also handles the commanding and various automatted functions of the instrument. The S3DPU is shared with the Solar Wind Ion Charge Spectrometer (SWICS) and the Solar Wind Ion Mass Spectrometer (SWIMS) and thus provides the same services for three of the ACE instruments. It has evolved out of a long family of data processing units for particle spectrometers.
- Institute for the Study of Earth, Oceans and Space, University of New Hampshire, Durham, NH 03824
- Max-Planck-Institut für extraterrestrische Physik, Postfach 1603, D-85740 Garching, Germany
- Institut für Datenverarbeitung, Technische Universität Braunschweig, Postfach 3229, D-38106 Braunschweig, Germany
- Fachbereich Elektrotechnik, Fachhochschule Landshut, Am Lurzenhof 4, D-84036 Landshut, Germany
- Battel Engineering, 10020 North 58th Street, Scottsdale, AZ 85253
- Cravens Engineering, 1309 Bristol Drive, Iowa City, IA 52240
- Design Net Engineering, 1968 Mountain Maple Ave., Highlands Ranch, CO 80126
1. Introduction and Scientific Objectives
The ionic charge state Q is an important parameter for deciphering the local conditions at the origin of energetic particle populations as well as the processes involved in their selection, acceleration and transport. First direct measurements of the charge state of solar energetic particles in the energy range of 0.3 - 3 MeV/nucleon were carried out using the Ultra Low Energy Z E Q (ULEZEQ) sensor on the International Sun-Earth Explorers (ISEE-1 and -3) (Hovestadt et al., 1978). More recently the measurements have been extended to higher energies by utilizing the Earth's magnetic field as a spectrometer with several instruments on the Solar Anomalous and Magnetospheric Explorer (SAMPEX) mission (Mason et al., 1991; Baker et al., 1993; Klecker et al., 1993). These approaches have allowed the determination of average charge states in solar cosmic rays (Hovestadt et al., 1981), interplanetary accelerated particles (Hovestadt et al., 1982) and the confirmation that anomalous cosmic rays (ACR) are mostly singly charged (Klecker et al., 1995). However, questions concerning the detailed charge state and/or individual physical processes involved have been left open because of either the lack of individual charge state resolution or poor counting statistics.
1.1 Solar Energetic Particles
Over the last decade it has been recognized that solar energetic particle events (SEP) can be traced back to basically two classes of solar flares. Impulsive flares are characterized by short time scale (several minutes) electromagnetic (radio and X-ray) emission, generally low fluxes of energetic particles in interplanetary space, a high electron to ion ratio, and substantial enhancements in the abundances of heavy ions and 3He over 4He (Mason et al., 1986; Reames, 1990). Gradual solar flares are accompanied by long duration radio emissions that are generally associated with shocks in the corona and emit high fluxes of energetic particles with a low electron to ion ratio and abundances that reflect normal solar corona conditions (e.g. Reames, 1992). It is assumed that the ionic charge state of energetic ions from these flares carries the information on the coronal temperature within the flare site, because the charge stae is quickly frozen in during the acceleration process and the column density of matter between the sun and the observing spacecraft is very low. It is common to deduce a coronal temperature from the measured average charge state assuming ionization equilibrium (e.g. Arnaud and Rothenflug, 1985).
The average charge state of heavy ions during impulsive 3He-rich flares has been found to reflect temperatures of the order of 107 K (Klecker et al., 1984; Luhn et al., 1987). However, because of the low energetic ion fluxes during these events only average values over the full complement of events during the entire observation period could be obtained. At this point it is not known whether the relatively wide charge distribution that has been seen is due to substantial variations from event to event or is a real feature during individual events. Clearly the collecting power of a charge sensitive instrument has to be substantially increased in order to allow a detailed study of individual impulsive events in order to make progress on local heating and selective acceleration processes prevalent in these flares.
Contrary to the impulsive flares, gradual events exhibit charge states that reflect substantially lower temperatures in the neighborhood of 1 - 2  106 K (Hovestadt et al., 1981). In addition, different species seem to indicate different temperatures. Attempts to explain these variations in terms of non-thermal conditions in the flare site or through interaction of the accelerated particles with coronal material have been unsuccessful (Luhn et al., 1984). In the most promising interpretation Mullan (1986) suggested that heating and ionization in flares through local X-ray generation plays a role. In order to study the significance of such processes on the ionic charge states it is necessary to narrow the measurements down on individual charge states, since this will allow a much more precise deconvolution of the energy distribution of the electrons and/or X-rays that have produced the observed charge states. The goal requires a substantial improvement in the charge state resolution over previous instruments.
1.2 Interplanetary Accelerated Particles
Two types of interplanetary accelerated particles have been observed, ion populations associated with corotating interaction regions (CIR), where high and low speed solar wind streams meet, and coronal mass ejection (CME) related particle events, where acceleration occurs at the corresponding shock waves. During the operational phase of the ISEE instrument (around solar maximum) no good signatures of CIRs were observed. In CME related events charge states were found that are basically compatible with the charge states in gradual solar flare particle populations (Hovestadt et al., 1982). It came as a surprise that a class of apparently interplanetary events, i.e. events that could not be correlated with solar flare activity, was detected that had an unusually high abundance of He+ (Hovestadt et al., 1984). No accompanying low charge state heavy ions were found beyond the detection threshold of the instrument. More recently Gloeckler et al. (1994) have pointed out that the high He+/He2+ ratio observed by ISEE may be produced by the acceleration of interstellar pickup ions at interplanetary shocks. With their wide velocity distribution these ions may present a source population for very efficient further acceleration in interplanetary space (Möbius et al, 1985). To delineate the source distributions of CIRs and CME related energetic particle events again a larger collecting power of the instrument is needed.
1.3 Anomalous Cosmic Rays
The anomalous cosmic rays are thought to be a final product after pickup of interstellar ions and their acceleration at the heliospheric termination shock (e.g. Fisk et al., 1974; Jokipii, 1986). With the SAMPEX mission it has been well established now that these ions are indeed mostly singly charged (Klecker et al., 1995). However, the measurements using the cut-off rigidity in the Earth's magnetic field have been restricted to energies > 8 MeV/nucleon. A low background large geometric factor instrument for ionic charge state determination will be able to extend these results to the lower end of the ACR spectrum.
1.4 Instrument Performance Requirements
Within a complement of high-resolution spectrometers to measure the composition of solar, local interstellar, and galactic cosmic ray material on the Advanced Composition Explorer (ACE) (Stone et al., 1998a) the SEPICA instrument is the prime sensor for the determination of the charge state distribution of energetic particles. Its basic design requirements are to measure the ionic charge state, Q, the kinetic energy, E, and the nuclear charge, Z, of energetic ions in the energy range 0.2 - 3 MeV/Nuc for elements H through Fe. As a consequence of the scientific objectives listed above several substantial improvements over previous instrumentation are required. The need to resolve individual charge states at least in gradual flares for species such as oxygen and carbon requires a charge state resolution Q/Q  0.1 over a substantial energy range. For practical reasons charge resolution is limited towards higher energies. Therefore, we adopt a goal for single charge state resolution up to 1 MeV/charge. Since 3He-rich flares are to be studied, SEPICA also needs to separate isotopes for low mass number species, in particular 3 He and 4He. On the other hand these impulsive flares as well as CIRs and ACR are known for low particle fluxes. In order to accumulate data with sufficient counting statistics a substantially larger geometrical factor than SEPICA's predecessor, the ULEZEQ sensor on ISEE-1 and -3, is necessary. To improve on previous measurements by at least one order of magnitude, we adopt a geometric factor of
  0.2 cm2sr. For the very low fluxes in CIRs and ACR the large geometric factor must be accompanied by a low background susceptibility.
It should be pointed out here that generally the two requirements of a) higher charge state resolution and b) larger geometric factor are mutually exclusive, if an instrument of the same size and with the same resources is to be built. To achieve higher resolution with any deflection technique a collimation to a smaller acceptance angle range has to be chosen, which in turn leads to a reduced collecting power of the sensor. Therefore, the SEPICA sensor is significantly larger than the ULEZEQ sensor, and we have chosen a modular approach with three individual fans that allows a separate optimization of these competing goals in individual sensor sections.
We start this paper with the principles of operation in chapter 2, followed by the description of the SEPICA sensor subsystems in chapter 3. The sensor electronics and the internal data selection and processing are described in chapter 4 followed by the sensor calibration and performance in chapter 5. The supporting subsystems, such as high voltage generation and gas regulation are presented in chapter 6. The mechanical packaging and thermal aspects are covered in chapters 7 and 8. The description of the common data processing unit (S3DPU) for SWICS, SWIMS and SEPICA that has been designed and built by the Technische Universität Braunschweig (TUB) under guidance of the University of New Hampshire (UNH) is included in this paper in the concluding chapter 9. It should be noted that several subsystems provided challenges which were met with novel designs that have pushed technical limits. These technical aspects are covered in the corresponding chapters. For example, the design of the high precision collimator system and the integration of many electrical feedthroughs into the ceramic frames of the multi-wire proportional counter are described in chapter 3. A novel arrangement for a 30 kV supply and the first use of micro-machined bi-metallic valves in the isobuthane gas flow system are presented in chapter 6. Thus the paper combines the functional description of the SEPICA instrument with a reflection on how some of its biggest technical challenges were met.
2. Principles of Operation and Basic Design
To simultaneously determine the energy E, nuclear charge Z and ionic charge Q of incoming particles the SEPICA sensor combines several different measurement methods. The analysis of each ion starts with the determination of the electrostatic deflection of incoming ions in a collimator-analyzer assembly. Then the energy loss and the residual energy are measured in a dE/dx - E telescope. Potential background from penetrating radiation is suppressed by the use of an anti-coincidence detector. The instrument is based on the general design of the ULEZEQ sensor flown on the ISEE spacecraft (Hovestadt et al., 1978).
2.1 Measurement Methods
SEPICA consists of three independent sensor units, called "fans". Each of the three fans is symmetric about the plane with the high voltage deflection plate. A schematic view of one individual sensor unit is shown in Fig. 2.1 together with the basic measuring principles. Shown is a single side of one SEPICA fan. Energetic particles enter a multi-slit collimator, which selects those incoming particles that target a narrow line in the detector plane (indicated by F, the "focal line"). They are electrostatically deflected between a set of electrode plates. The curved plate is on ground potential, while the flat center plate is supplied with a positive high voltage up to 30 kV (to be set by telecommand). In Fig. 2.1 a pair of undeflected ion trajectories (full lines) is shown along with a pair of deflected trajectories (dashed lines). The deflection, which is inversely proportional to energy per charge, E/Q, is determined in a multi-wire thin-window proportional counter. The proportional counter is also used to measure the specific energy loss dE/dx of the ions, which depends on the energy E and the nuclear charge Z of the particle. Finally, the residual energy of the particle, ERes, is directly determined in a silicon solid-state detector (SSD). An anti-coincidence system covers the rear side of each detector assembly to suppress background signals from penetrating high energy particles. This is of particular importance for the study of low fluxes in weak solar events and during quiet times. It consists of a CsI scintillator which is viewed by silicon photodiodes.
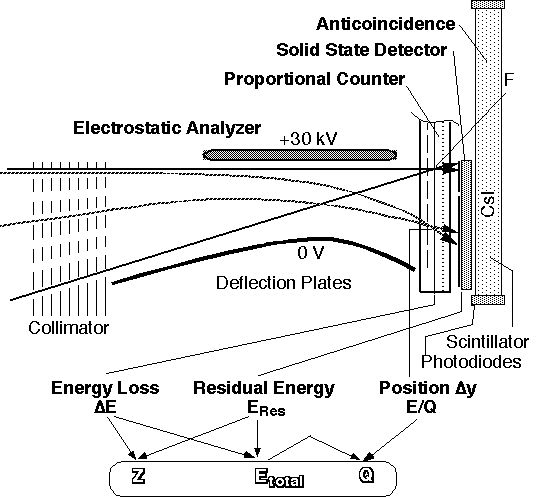 Fig. 2.1: Schematic view and principles of operation of the SEPICA instrument.
The identity of each incoming ion is determined in two consecutive steps that are illustrated in Fig. 2.2. For energies above approximately 1 MeV/nucleon the specific energy loss dE/dx of ions can be approximated by the relation
dE/dx =  Z2(E/A)
 (2.1)
(2.1)
i.e. it is only a function of the nuclear charge Z and the energy/mass E/A, where A denotes the atomic mass number. is negative and of the order of 1, i.e. the energy loss falls with increasing energy. is a constant that summarizes the effects of the target gas in the proportional counter. Below 1 MeV/nucleon partial recombination in the interaction with the target material reduces the effective charge of the ion to values Z* < Z so that the specific energy loss decreases with decreasing energy. Therefore, the typical dE/dx versus ERes curves in the left panel of Fig. 2.2 have a maximum at 1 MeV/nucleon. Because the energy loss is a function of energy/mass (E/A) and not of total energy the curves for different isotopes of the same element are separated by their total energy according to the isotope mass A as indicated for He.
Etotal = (E/A)*A (2.2) 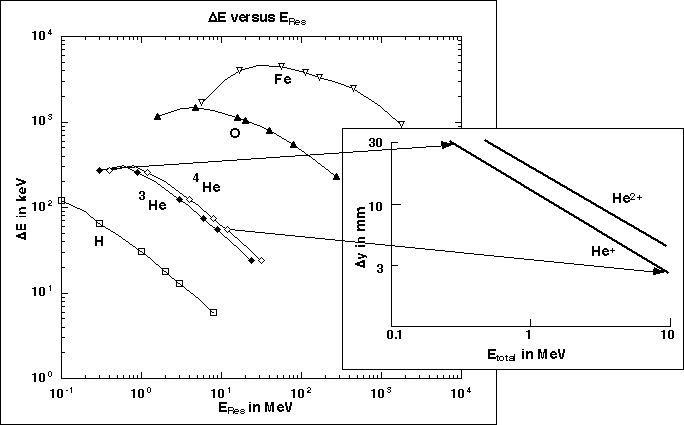
Fig. 2.2: Energy loss ( E) versus residual energy (ERes) curves for H, 3He, 4He, O, and Fe (background panel). After selection of one element or isotope curve (here 4He) the charge states can be separated from their deflection y in the electrostatic analyzer (foreground panel).
This leads to a differentiation in the measured residual energy ERes, and thus isotopes can be identified with SEPICA for low Z ions, such as He. The final parameters for the sensor are obtained in calibration. The same method for the determination of elements and isotopes at higher energies (> 10 MeV/nucleon) is used in the Solar Isotope Spectrometer (SIS) (Stone et al., 1998b) and the Cosmic Ray Isotope Spectrometer (CRIS) (Stone et al., 1998c) on ACE.
With the knowledge of the species the measured residual energy can now be corrected for the accumulated energy loss effects in the sensor according to
Etotal = ERes + EWindow + EPC + ESSD (2.3)
where EWindow is the energy loss in the front and rear windows of the proportional counter, EPC is the loss in the counter gas which includes contributions from additional dead layers in the counter, and ESSD is the loss in the entrance layers of the solid state detector. All these contributions are determined in sensor calibrations with radioactive sources and at particle accelerators. According to
Q = (Q/E)*Etotal (2.4)
the ionic charge state can be computed by combining the total energy (E) with the energy/charge (E/Q) as derived from the deflection Y of the ions in the electrostatic analyzer voltage Udefl
Y =  Udefl
Q/E (2.5)
Udefl
Q/E (2.5)
where is a sensor constant that depends on the size and geometry of the analyzer. SEPICA has been designed so that a typical deflection of 10 mm is achieved for 1 MeV/charge ions with a deflection voltage of 30 kV. The spread of charge states for a selected ion species is sketched in the right panel of Fig. 2.2. The charge resolution is reduced with increasing energy. The determination of average ionic charge states can still be achieved up to 5 MeV/charge. The ion species and energy can be derived for all ions that are stopped by the SSD.
2.2 Design Goals and Capabilities
The instrument capabilities of SEPICA are compiled in Table 2.1. The capability of SEPICA to resolve details of the ionic charge states is restricted to the energy range between 0.5 and 3 MeV/charge, with determination of the average charge state up to 5 MeV/charge. Over a wider energy range (e.g., up to about 6 MeV/nuc for Fe and O) element identification with energy determination will be possible. For SEPICA two specific goals were set: For energies 1 MeV/charge a resolution Q/Q 0.1 (FWHM) should be achieved. On the other hand the instrument should have a total geometric factor of at least 0.2 cm 2 sr.
In order to achieve the two seemingly mutually exclusive goals, i.e. to provide high sensitivity for the study of small solar energetic particle (SEP) events and to reach high charge state resolution to resolve individual charge states, SEPICA has been subdivided into three nearly independent sensor fans. The detector systems, their respective electronics, and the electrostatic analyzer are identical for all three fans. However, there are two different versions of the entrance collimator. Two fans are identical in the geometry of the slit collimator and have a combined geometric factor of about 0.2 cm 2 sr, which is sufficient in the expected counting rate for even small SEP events such as 3He-rich solar flares. The third fan has a slit system, whose open width is narrower by a factor of three, in order to allow for a charge resolution which is higher by a factor of three. As a result, the geometrical factor of this fan is reduced to 0.03 cm 2sr. Therefore, the sensitivity of this portion will be sufficient only during relatively large SEP, CME, and CIR events, when the particle fluxes are high or when a long accumulation time is possible. With these capabilities SEPICA is greatly improved (in both sensitivity and charge resolution) over its predecessor, the ULEZEQ sensor on ISEE-1 and -3. The required resources are compiled in Table 2.2.
Table 2.1: SEPICA Performance
|
Energy Range
|
Resolution
|
Elements
|
|
H: 0.2 - 3 MeV
|
|
|
|
He: 0.3 - 6 MeV/N
|
isotopic, A < 1 |
H to He |
| O: 0.2 - 15 MeV/N |
individual elements, Z < 1 |
H to O |
| Fe: 0.1 - 5.4 MeV/N |
groups, Z 2-3 |
O to Fe |
|
|
Low Res. Fans
|
High Res. Fan
|
|
Geometric Factor
|
0.2 cm2sr |
0.03 cm2sr |
|
Energy Range
|
Charge Resolution Q/Q
|
| E 1 MeV/Q |
0.3 |
0.11 |
| E 3 MeV/Q |
1 |
0.32 |
Table 2.2: SEPICA Resources
|
Resource
|
Measured
|
| mass |
37.4 kg |
| power* |
18.5 W nominal, 19.5 W peak |
| average data rate** |
608 bps |
* Includes 2 watts of power for internal thermal control
** Peak data rate of SEPICA must be coordinated with the data requirements of the SWICS and SWIMS instruments such that the total rate available to the S3DPU (1624 bps) is never exceeded.
3. Sensor Description
The SEPICA sensor consists of six separate sections that are functionally identical to the schematics in Fig. 2.1. Two sections that are the mirror image of each other are combined into sensor fans. Each sensor fan consists of a collimator, electrostatic deflection plates, a proportional counter, two solid state detectors (SSD) and the anti-coincidence system. The back portion of each fan is composed of one dE/dx thin-window proportional counter, serving two instrument sections. A set of six solid state detectors, one for each section, is placed behind the counters. Three anti-coincidence assemblies are placed behind the solid-state detector plane, each serving two sections. The fans have been built as separate units that could be integrated and tested independently of each other. All three fans have the same field-of-view and are mounted such that their center viewing direction points at an angle of 61.5° with respect to the spin axis as shown in Fig. 3.1. SEPICA sweeps out an angle band of ± 41° by 360° centered at this direction. The instantaneous field-of-view is 82° by 17°. Because the spin axis remains within < 20° of the sun, no sunlight will enter the SEPICA sensor.
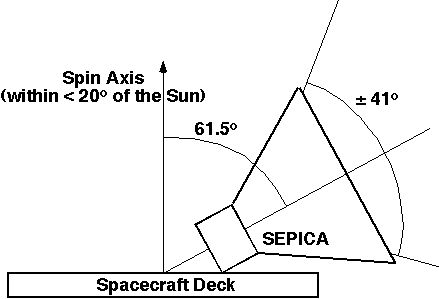
Fig. 3.1: Schematic of the orientationand the field-of-view of the SEPICA sensor on the ACE spacecraft.
3.1 Electrostatic Analyzer Sections
One geometrically flat, positive high voltage plate (nominally at 30 kV) is employed for two neighboring instrument sections. When the high voltage is applied, the particles, which are originally passively collimated by the entrance collimator towards the focus "F" (in Fig. 2.1), will be deflected towards the curved ground-plates in each section. The high voltage plate has been designed as a hollow Ultem structure which is sandwiched between two 0.5 mm Al plates. It has been plated with a sequence of Cu and Au plating. At the ends the plate is thickened to minimize edge effects and to allow the Ultem insulator mounting and thus the very sensitive high voltage triple conjunctions (between conductor, insulator and vacuum) to be recessed into a low electric field region. The 30 kV HV cable is inserted through the insulating mounting into the center of the plate, so that the physical connection is made in the interior which is a perfect equipotential region. This connection also contains a 40 M  resistor that filters the remaining ripple of the HV supply together with the intrinsic capacitance of the analyzer of 40 pF.
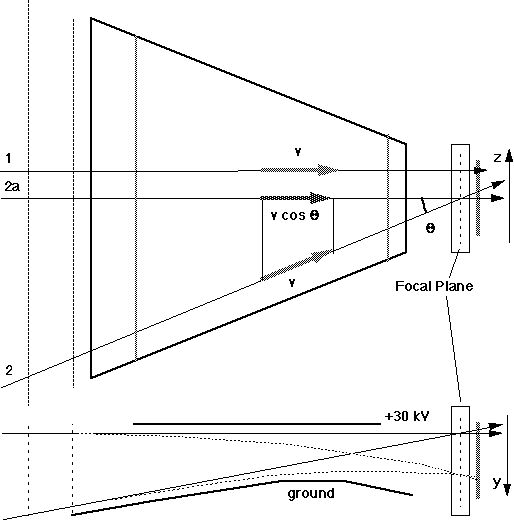
Fig. 3.2: Top view and cross-sectional view of electrostatic analyzer and sample trajectories. The trajectory of the projection 2a of trajectory 2 is the same as that of 1, if only the projection of the ion velocity of 2 is considered.
The collimator consists of a flat stack of plates which produces a well-defined focal line in the detector plane. The deflector plates are trapezoid shaped. The geometry is shown in Fig. 3.2 together with sample ion trajectories. As a consequence of the flat collimator-analyzer geometry incoming particles with the same velocity vo perpendicular to the detector plane are deflected by the same amount. Therefore, a correction has to be applied to ions that enter the sensor at oblique angles, but with the same total energy. This necessitates the determination of the incoming angle  in the plane parallel to the deflection plate. For the computation of the ionic charge Q the energy component perpendicular to the detector plane
E
 = E · cos2
(3.1)
= E · cos2
(3.1)
is used, where E represents the total energy of the incoming ion that is actually measured in the sensor. The angle is determined with two position measurements in the z-direction (parallel to the deflection plate) of the instrument.
While this approach requires additional resources in the sensor to provide the information on the angle , it has several advantages over the implementation in the ULEZEQ sensor (Hovestadt et al., 1978) where the trajectories through the electrostatic analyzer have been optimized using a curved collimator plate geometry even for oblique angles. Firstly, such an optimization cannot be used simultaneously for a wide acceptance angle range and a large area detector system, a combination that is required to achieve a large geometric factor. Secondly, the mechanical precision of the collimator stack is greatly improved for a flat geometry along with a substantial simplification of the mechanical integration. The entrance apertures of the SEPICA sensor are shown in Fig. 3.3.
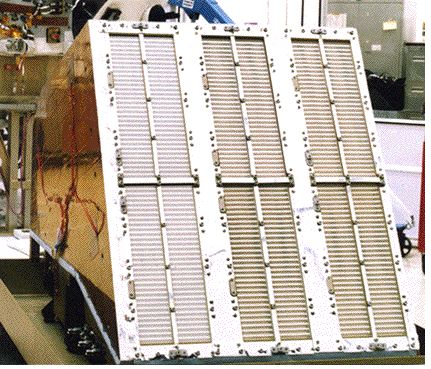
Fig. 3.3: Front view of SEPICA with all three apertures.
3.2 Collimator Design
The collimators are comprised each of two half stacks of precision etched, 0.10 mm thick BeCu collimator plates. The half stacks are a mirror image in elevation, with one half stack covering the upper 41° and the other stack covering the lower 41° in elevation. Each plate has 32 rows of 5 mm long slits that extend ±260 mm in elevation grouped into two 40 mm wide columns on either side of the HV deflection plate. For the high resolution collimator, the slit width is 0.15 mm, with a 0.15 mm separation between slits at the outlet plate. The two low resolution collimators have outlet plates with 0.45 mm slit widths and 0.155 mm slit spacing. Each stack contains 13 etched plates that are separated by precision thickness (± 0.025 mm tolerance) aluminum and magnesium spacer plates for a total stack thickness of 40 mm. The collimators are assembled by placing alternating layers of BeCu and spacer plates onto three precision 3/16" stainless steel dowel pins protruding from an 8 mm thick aluminum mounting plate. Alignment is accomplished by gently pushing (with silicone rubber faced right angle blocks) the edges of the plates so that the slots become tangent with the three pins. An aluminum clamping plate is placed over the inlet etched plate to uniformly clamp the stack, and to couple the upper and lower half stacks together.
The collimator assemblies achieve nearly zero alignment tolerance by placing the majority of the burden on the etching and machining precision, in lieu of some elaborate alignment scheme. By direct CAD file transfer errors in graphics interpretation were avoided. Further, by holding the etching vendor (Tecomat) to ±0.01 mm locational and size tolerances for the slits, and ± 0.005 mm for the alignment slots, the plates established a new benchmark in precision wet etching. Combining these break throughs in etching tolerance with CNC drilling of the mounting plate pin holes, and careful (perpendicular) installation of the screened (size and straightness) dowel pins, assembly was possible with only 0.013 mm clearance about the alignment pins. This clearance represented less than 10% of the critical spacing between adjacent slits for both the high and low resolution outlet plates. Clearly the bulk of the alignment was designed and fabricated in the parts.
3.3 Multi-Wire Proportional Counters
Three geometrically flat, multi-wire, dE/dx proportional counters are used, each serving two instrument sections in a single sensor fan. The proportional counters serve several purposes in the SEPICA sensor:
1) They are used to determine the specific energy loss dE/dx of the incoming ions in the counter gas. This signal is taken from the central anode wire plane of the counter, whose wires are all interconnected and to which a positive bias voltage is applied. The dE/dx signal is also used as the master trigger signal for the electronic readout and event identification circuits of the instrument.
2) In the two cathode layers between which the anode plane is sandwiched the position of the penetrating ion is determined in two dimensions. The cathode wires are grouped in bands of seven wires each that are read out by individual signal channels. In the front cathode the position in the y-direction, i.e. the direction of electrostatic deflection, is determined. In the rear cathode the position in z is determined. Together with another z-measurement in the solid state detectors the incoming angle of the ions in elevation is derived.
Such a multi-wire proportional counter has been successfully flown as an imaging detector for X-ray astronomy in the focal plane of the Wolter telescope on the German X-ray satellite ROSAT (Pfeffermann et al., 1987). In order to achieve optimum position resolution the center anode plane of the counter is the focal plane of the collimator.
- Energy-loss determination
The energy loss of the ions in the counter depends on the gas density and the thickness of the gas layer. The ions lose energy mainly due to ionizing collisions with electrons. The resulting charge of the ion-electron pair production is proportional to the total energy loss. The counter is operated in its proportional regime, i.e. a constant gas amplification of this charge signal is achieved by electron multiplication in the increased electric field close to the anode wires. The anode wires are 10 µm diameter tungsten wires, separated from each other by 2 mm. With an isobutane filling of nominally 20 Torr and an operational voltage of 1000 - 1100 V an amplification by 100 is achieved.
- Position measurement
The position of an incoming ion is determined by the localization of the charges at the anode. Therefore, the anode has been chosen as the focal plane. The charges are concentrated on only a few anode wires. However, the image charges of the electron signal produced on both cathodes and the ion clouds that migrate from the anode to the cathodes are distributed over several adjacent wire strips in both cathode planes, as is depicted in Fig. 3.4. As a result a charge distribution is recorded whose width is comparable to the anode cathode separation distance. The cathodes consist of 50 µm stainless steel wires with a pitch of 0.5 mm, grouped into signal strips of eight wires each (3.5 mm wide and 0.5 mm apart). This configuration produces an optimum position resolution for the counter geometry. The charge clouds are typically distributed over five such strips. The position is derived from the center of gravity of the distribution. In the front cathode the position in the direction of the electrostatic deflection (y-direction) is determined, while in the rear cathode the position along the focal line (z-direction) is measured.
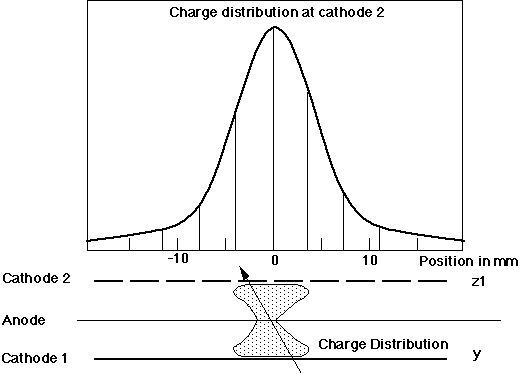
Fig. 3.4: Distribution of charged particles generated by an ion that penetrates the proportional counter. The position is determined from the center of gravity of the distribution over five adjacent cathode wire strips (3.5 mm width and 0.5 mm separation) on both cathode 1 and 2.
- Counter assembly
The proportional counters are sealed volumes through which isobutane is flowing at a constant rate such that an operational pressure of 20 Torr is maintained. In order to minimize the buildup of carbon compounds from the isobutane on the anode wires during operation the gas is completely exchanged every 4 hours. In addition, care has been taken in the choice of materials in the counter volume and plumbing. Further an admixture of 2% methanol reduces the destruction of isobutane molecules under radiation (Va`vra, 1986).
Because the SSDs are mechanically separated from the counters, two windows (front and rear) are needed to close the volume. In order to minimize the energy loss of the incoming particles in the windows they had to be made as thin as possible while still providing a sufficient margin for the differential pressure applied. In addition, a conducting surface was necessary to provide equipotential surfaces inside the counter volume. Polyimide windows with a thickness of 0.5 µm and a 500 Å Al layer on an Al frame with a stainless steel support grid, supplied by Luxel Corp., Friday Harbor, WA, was used for this purpose. This allowed a significant reduction of the energy loss in the windows compared with the 450 µg/cm2 Ni window of the ISEE ULEZEQ sensor, although SEPICA needs two windows. As an illustration for this improvement take the energy loss of 4He at 0.34 MeV/nucleon, the low energy threshold for He with ULEZEQ: the loss in the combination of both polyimide windows is 0.24 MeV compared with 0.34 MeV in the single Ni window. Together with a 20 mm column of isobutane at 20 Torr in the counter a reduction of the total energy loss by 40% over that of ULEZEQ has been achieved which allows a significant reduction of the low energy threshold for SEPICA.
The windows have withstood a pressure of up to 60 Torr without a sign of permanent stretching. Much higher overpressures could be applied without rupture. The danger of destruction due to micrometeorites is very low. Due to the presence of the slit collimator in front of the proportional counter the probability of damage to the windows from micrometeorite impact during a 5 year mission lifetime is estimated to be <0.5%.
The counter design requires one anode plane and two cathode planes with 10 µm and 50 µm wires exactly spaced by 2 mm and 0.5 mm, respectively. The wires are placed on structural Macor frames on a custom made precision winding machine, then bonded in place with adhesive and soldered to metal traces. The challenge in this configuration is to carry the signal lines from the cathode plates out to the support electronics while maintaining the pressure volume integrity. In the ROSAT counter the anode and cathode plates were placed within the gas volume thereby requiring a containment vessel and additional signal feedthroughs. With SEPICA, to allow three counter systems close to each other and to minimize the instrument size and mass, the novel approach of integrating the containment and the signal feedthroughs into the counter plates was undertaken. Therefore, the assembly of the counter is broken into six primary component layers with O-ring seals between each of them: the inlet and outlet thin film windows on Al frames, a gas interface plate made from Ultem, the front and rear cathode plates, and the center anode plate, all three of them made from Macor.
The biggest challenge was introduced by the need to hermetically seal 21 electric feedthroughs in each cathode plate. In the SEPICA counter design this was achieved by developing "Surface Trace Feedthroughs" in cooperation with Ceramic-to-Metal Seals, Melrose MA. Signal line feedthroughs were fabricated into the surface of the Macor cathode plates by first milling shallow pockets into the Macor, filling the pockets with Dupont Silver #1773, firing the metallization, and then grinding the surface until the traces and Macor are flush. The bond between the Macor and metallization is virtually leak tight, and the resulting surface finish after grinding is O-ring seal quality. The surface traces are solderable in their fired state (2% Ag solder required), allowing the cathode wires to be soldered inside the O-ring envelope, and the electronics interface connector to be soldered outside the envelope. The remaining single 2 kV feedthrough for the anode plate is a more conventional single O-ring seal with a Ni plated Ti conductor compressing a small O-ring in a reamed bore in the anode plate.
The assembly is integrated from the anode plate outward, i.e., each cathode plate is fastened separately with approximately 20 vented cap screws to the anode plate. A custom 1 mm cross section Buna-N O-ring is placed between each plate to form the seal. The Ultem 1000 gas plate is fastened to the front cathode. The inlet and outlet windows are attached to the gas plate and the back of the second cathode, respectively. A proportional counter assembly is shown in Fig. 3.5.
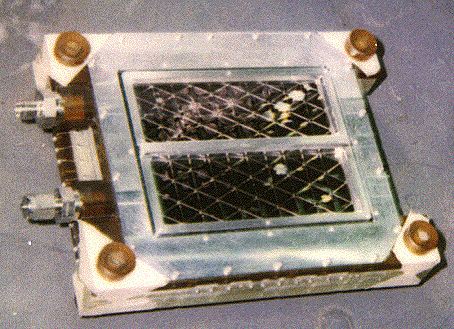
Fig. 3.5: SEPICA proportional counter assembly, as seen from the front side. The gas in- and outlet are on the left. In the Fan assembly the center bar of the window support is located exactly behind the HV deflection plate of the electrostatic analyzer.
3.4 Solid-State Detectors
Solid state detectors (SSD) are used for the determination of the total energy E of the incoming ions and of a second position along the focal line. Together with the corresponding position in the proportional counter the incoming angle of the ion can be determined in order to apply the necessary correction to the deflection in the electrostatic analyzer. Because of their excellent signal-to-noise ratio and to allow position determination ion-implanted silicon pixel detectors have been chosen. To cover the energy under consideration the thickness of the detectors is 500 µm. To facilitate the additional z-position measurement the SSDs are segmented into strips oriented along the y-direction. The layout of the detector is shown in Fig. 3.6.
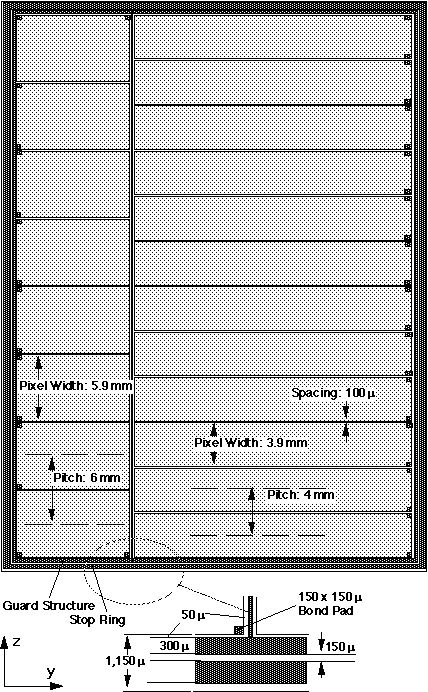
Fig. 3.6: Layout of the rear side of the ion-implanted silicon pixel detectors by Canberra, Belgium. The front side consists of a < 1000 Å thick dead layer with vacuum deposited Al.
Another challenge for the SSDs is the required dynamic range of total ion energies from 0.1 to 300 MeV. However, by making use of the electrostatic deflection ions with energies 1 MeV/charge are contained to within 10 mm from the undeflected focal line. Therefore, the SSDs have also been segmented into a high (1 - 300 MeV) and a low (0.1 - 30 MeV) energy section. The high energy section contains eight strips, while the low energy section has twelve strips. This arrangement has been optimized to the need of better angular correction in the low energy regime where a charge resolution Q/Q 10% can be achieved. To avoid cross talk on the SSD from the high to the low energy section a guard structure has been implemented in the layout. The stop ring avoids noise from imperfections at the edge of the SSD wafer. The two SSDs for each fan are mounted side by side directly on the printed circuit board with the SSD electronics. In this way noise pickup and electronic cross talk between channels could be minimized.
3.5 Anticoincidence Detectors
The anti-coincidence counters completely cover the back of the solid state detectors and extend beyond the sensitive area of the SSDs sufficiently to detect ions which penetrate the detector volume at oblique angles. CsI scintillators are used with Si photodiodes (by SILICON Sensors GmbH, Berlin) as light detecting devices. A similar arrangement has been successfully implemented in the SAMPEX HILT experiment (Klecker et al., 1993). Each of the three anti-coincidence units consists of a 100 x 60 mm CsI crystal with a thickness of 5 mm and a 3 mm acrylic backing. The scintillation signals are picked off by 20 Si photodiodes of 10 x 8 mm, 4 on each short side and 6 on each long side of the CsI crystal. The anti-coincidence assembly is mounted to the rear side of the SSD circuit board and covered with a ground shield. To avoid cross-talk between anti-coincidence and SSD channels the front side of the CsI crystal has been covered with a vapor deposited 1000 Å layer of Al. Together with the reflective paint that is applied to backing this maximizes the light collection of the detector system.
The assembled proportional counter is mounted together with the SSD assembly and anti-coincidence detector as well as the two remaining boards of the sensor electronics over the four Titanium alignment rods on a mounting frame. This mounting frame is used for integration with the electrostatic analyzer section of the sensor fan. Clamping nuts secure the PC and electronics, and a ground enclosure that contains the signal and power connectors shields the complete detector assembly.
4. Sensor Electronics
All sensor analog electronics is contained in the sensor Fans, while the conversion to digital signals and the event selection is carried out in the electronics box. This also houses most of the supporting electronics. Figure 4.1 shows the main functions in an electronics block diagram.
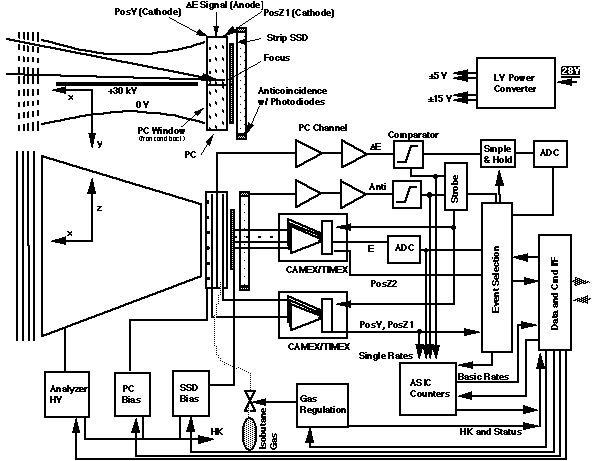
Fig. 4.1: SEPICA block diagram.
4.1 Analog Electronics
The analog electronics consists of individual amplifier chains for the dE/dx and anti-coincidence channels as well as CMOS VLSI circuits (CAMEX and TIMEX) which serve the position determination in the proportional counters and the energy measurement in the solid state pixel detectors. The individual amplifier chains for the PC anode and the anti-coincidence consist of an AMPTEK A250 hybrid circuit with a FET preamplifier stage, followed by pulse shaping. Each of the three fans contains one dE/dx and one anti-coincidence channel.
Each CAMEX (CMOS Multichannel Analog Multiplexer) contains 32 charge sensitive amplifier channels whose outputs are sampled by fast switches into storage capacitors. After completion of the measurement cycle the charge difference accumulated during the event is read from all channels sequentially into the following electronics (Lutz et al., 1987). The CAMEX was originally designed for high energy ion beam experiments, in which event timing is known a priori; i.e. the detection cycle can be treated synchonously with the experiment. In space applications the automatic sampling cycle of the CAMEX has to be interrupted at the detection of an incoming particle to allow a readout sequence. This readout is triggered by a signal in the corresponding dE/dx channel for the proportional counter/solid-state detector unit, provided that no high energy particle is signaled by the anti-coincidence detector. The necessary control electronics for the timing of the sampling and the readout is implemented in a custom VLSI called TIMEX. In order to miniaturize the electronics and to reduce cross-talk the CAMEX/TIMEX combination, including some passive circuitry, has been implemented on a custom hybrid, developed at the Fachhochschule Landshut, Germany. A similar hybrid was previously flown in the CELIAS instrument on SOHO (Hovestadt et al., 1995). On each CAMEX the user can select the gain for a group of sixteen channels from 0.12 and 2.2 V/fC.
Four CAMEX/TIMEX amplifier hybrids are used in each fan: two serve the position sensing in the PCs and the other two energy determination with the solid state detectors. Each proportional counter CAMEX is connected to 21 cathode wire groups. The connections are interleaved so that position information in both the rear (deflection direction) and front (focal line direction) planes is available on each CAMEX, thus providing partial redundancy. The high gain state of the CAMEX is used for the PC. Each SSD CAMEX serves one half of each of the two detectors with twenty individual pixels. The CAMEX channels that serve the eight pixels next to the deflection plate in the center of each fan, where the high energy ions hit, are switched to the low gain, while the remaining twelve pixels are set to the high gain state. The ratio of the two SSD pixel gains is 20, thus providing a nominal energy range of 0.1 - 300 MeV.
4.2 SEPICA
Digital Electronics
The SEPICA digital electronics consists of three "ADC/peak boards" (one per fan) on which the analog signals (dE/dx, PC positions, and SSD) are digitized and the peak positions are determined, one "event board" which selects valid events from the three fans and accumulates monitor rates from the event signals, and a "pre-processor board", which carries out initial processing of the data to reduce the number of bits per event into the data processing unit (S3DPU). The pre-processor was also necessary so that the same interface to the S3DPU could be used for SEPICA, SWICS and SWIMS.
Two basic types of data are generated in the SEPICA electronics: rate data and pulse-height analysis (PHA) event data. Event data contains detailed information about each particle which enters the instrument. Rate data contains count rates of individual signals and coincidences between signals, as shown in Table 4.1.
Table 4.1: Trigger conditions and related count rates for each of the three fans
|
Trigger
|
Description
|
| PPC_Trigger |
Trigger from the proportional Counter |
| PPC_Trig*Anticoincidence Trigger |
Anticoincidence Signal in coincidence with PPC_Trig |
| PPC*Anticoincidence Trigger |
PPC_Trigger NOT in coincidence with Anticoincidence |
| Valid Event |
Event satisfying the commandable Valid Event Criteria (given below) |
Event processing begins when a signal above threshold is detected by the PC anode and the selected conditions are met. In this case the signals are read from the E channel as well as from the cathode and SSD CAMEXes. They are converted in 11 bit ADCs. The single signal from the anode of the proportional counter goes through a high gain amplifier and a low gain amplifier. The difference between the two gains is a factor of 15. If the high gain signal exceeds a commandable threshold, the low gain is used. The outputs from the CAMEXes, the SSD signals and the position signals from the PC go through further processing on the ADC/peak board. The baseline level for each CAMEX output, which is stored in a lookup table, is subtracted from each measurement. The SSD pixel as well as the Y and Z strips in the PC with the largest signals are determined from the resulting signals. The energy signal is read from the selected SSD pixel. To determine the positions in the proportional counter in Y and Z, the peak signal plus the signals from the two adjacent strips on each side are selected. Prior to passing the data to the preprocesser board, it is determined whether the event is valid according to criteria in Table 4.2.
Table 4.2: Criteria for the validation of events in SEPICA
|
Criteria
|
Description
|
| PC Y-Position |
At least one wire strip had a signal over threshold |
| PC Z1-Position |
At least one wire strip had a signal over threshold |
| SSD-1 |
One and only one SSD strip had a signal over threshold. |
| SSD-2 |
At least one SSD strip had a signal over threshold |
Any combination of these PC Y, PC Z1, and SSD criteria, including disabling all checks, are allowed and can be set by telecommand. The default valid event condition is
PC Y-position · PC Z1-Position · (SSD-1) (4.1)
There are two sensor modes, "engineering mode" and "science mode". In engineering mode, the full set of pulse height signals as shown in Table 4.3 is transmitted unchanged for a limited number of events.
Table 4.3: Pulse height signals transmitted in engineering mode
|
Signal
|
Description
|
Quantity
|
Bits/item
|
|
E + gain bit |
PC anode signal (both gains) |
2 |
12 |
| E |
Energy (8 low, 12 high gain pixels, both SSDs) |
40 |
11 |
| Z2 |
Strip number of the peak SSD pixel |
1 |
5 |
| YC |
Pulse height of all strips in Y |
21 |
11 |
| YP |
Strip number of peak Y strip - 2 |
1 |
5 |
| Z1C |
Pulse height of all strips in Z1 |
21 |
11 |
| Z1P |
Strip number of peak Z strip - 2 |
1 |
5 |
| Fan ID |
Fan ID |
1 |
2 |
| SSD ID |
Identifies top or bottom half of fan |
1 |
1 |
In science mode the information for each valid event is already limited to the most important signals upon transfer into the pre-processor board according to Table 4.4.
Table 4.4: Pulse height signals passed into the pre-processor in science mode
|
Signal
|
Desciption
|
Quantity
|
Bits/item
|
|
E + gain bit |
the proportional counter signal |
1 |
12 |
| E |
Peak Energy from the SSD's |
1 |
11 |
| Z2 |
Strip number of the peak SSD |
1 |
5 |
| YC |
Pulse height of strips surrounding Y peak |
5 |
11 |
| YP |
Strip number of corresponding Y strips |
5 |
5 |
| Z1C |
Pulse height of strips surrounding Z1 peak |
5 |
11 |
| Z1P |
Strip number of corresponding Z strips |
5 |
5 |
| Fan ID |
Fan ID |
1 |
2 |
| SSD ID |
Identifies top or bottom half of fan |
1 |
1 |
In science mode, the pre-processor board reduces the information to be transmitted even further. It calculates the total deflection Y of the incoming ion in the deflection field according to
Y =  i(YPi*YCi)/
i(YCi) (4.2)
i(YPi*YCi)/
i(YCi) (4.2)
where YPi
is the wire position and YCi
is the pulse height amplitude for each cathode strip. The Z position Z1 is calculated from the amplitude distribution at the rear cathode in a similar way, whereas the Z position Z2 taken in the SSDs is the center position of the SSD pixel with the maximum signal. Finally, the two Z positions Z1 and Z2 are combined into the difference |Z1-Z2| which is proportional to the tangent of the incoming angle parallel to the fan plane. The locations of the center of each wire strip and of each SSD pixel are stored in a lookup table so that the SSD position, Z2, and the PC position, Z1, will be in the same units, with the origins of Z1 and Z2 aligned such that Z1 = 0 and Z2 = 0 corresponds to  = 0. Figure 4.2 shows the Z1 (PC) and Z2 (SSD) planes and indicates for a sample trajectory how |Z1-Z2| is used to determine the incident fan angle . The PC cathode strip numbers and the high gain pixels of the SSD are shown.
The pre-processor also drops the LSB from the E signal thus returning E`, and it adds a gain bit to the E` and the SSD energy signal.
= 0. Figure 4.2 shows the Z1 (PC) and Z2 (SSD) planes and indicates for a sample trajectory how |Z1-Z2| is used to determine the incident fan angle . The PC cathode strip numbers and the high gain pixels of the SSD are shown.
The pre-processor also drops the LSB from the E signal thus returning E`, and it adds a gain bit to the E` and the SSD energy signal.
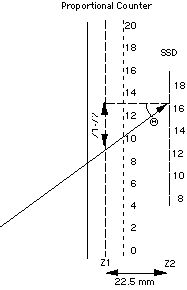
Fig. 4.2:
Schematic of fan angle , and the Z1 and Z2 directions.
The processed PHA event data that is transferred into the S3DPU is compiled in Table 4.5.
Table 4.5: PHA event data as transferred into the S3DPU
|
Signal
|
Desciption
|
Quantity
|
Bits/item
|
|
E` + gain bit |
PC anode signal |
1 |
11 |
| E + gain bit |
Peak Energy from the SSDs |
1 |
12 |
| Y |
Computed position in deflection direction |
1 |
10 |
| |Z1-Z2| |
Computed angle in fan direction |
1 |
8 |
| Fan |
Fan ID |
1 |
2 |
| SSD ID |
Identifies top or bottom half of fan |
1 |
1 |
| Mode |
0 = Science, 1 = Engineering |
1 |
1 |
4.3 Event Processing in the S3DPU
The SEPICA instrument is served by a common Data Processing Unit (S3DPU) together with the SWICS and SWIMS experiments. In this section the requirements for the S3DPU from the side of SEPICA and the data stream through the unit are compiled. A brief description of the S3DPU architecture is given in section 9.
- Basic and Matrix Rate Data
In the S3DPU, the event data is accumulated on-board into bins representing specific species, energies and charge states. Prior to the accumulation, two corrections are applied to the data.
i) The E signal is corrected for the path length through the PC:
E` = E*cos
(4.5)
ii) The deflection Y is corrected for traversal of the electrostatic analyzer at oblique angles:
`= Y*cos2
(4.6)
These corrections are made using a look-up table for cos and cos2
, given the value |Z1 - Z2|. The charge state is then calculated according to
Q
*
= C1* Y` *ERes
(4.7)
where C1 is a constant determined by calibration.
Using the values of ERes, E`, and Q*, each event is accumulated into two types of "Classification Rates": Basic Rates and Matrix Rates. Both sets of rates cover the full valid event range in ERes, E`, and Q*. The Basic Rates are larger bins, designed to grossly divide up the data into protons, helium, and heavy ions. The basic rates are not further divided into charge states ranges. The boundaries for the basic rates are also the boundaries that determine the priorities for the PHA Data. The Matrix Rates divide the data more finely into individual species and into charge state ranges. The boundaries for the Basic Rates and Matrix Rates as defined for the start of the mission are shown in Figs. 4.3 and 4.4. These boundaries are adjustable by telecommand.
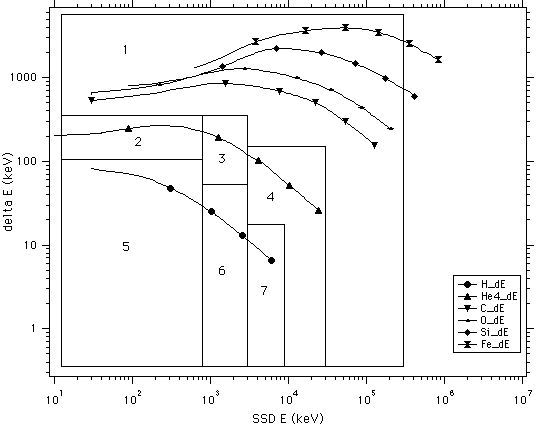
Fig. 4.3: Basic Rate Boxes in E - E space. Hydrogen (both neutral and ionized) is contained in the BP rates and priorities (4, 5, 6) and He (charged and neutral) in the BA rates and priorities (1, 2, 3). All other ions and neutrals are contained in the BH rate and priority (0).
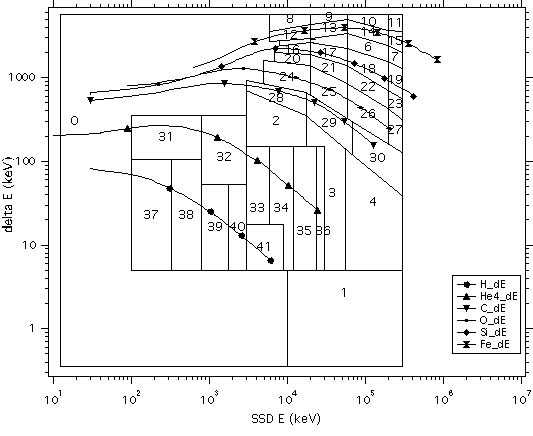 Fig. 4.4: Matrix boxes for the SEPICA sensor.
The charge state represents the third dimension in Fig. 4.4. The shape of the boxes in E and E remains the same throughout the entire Q range. The limits for the charge ranges are defined individually for each element and energy range. The ranges in Q are contiguous, and there is no overlap. The maximum of the last box is the maximum allowed Q, 31 (or 5 bit for Q). The Q ranges for each of the matrix elements are shown in Fig. 4.5. The physically reasonable range for each element is shaded.
Fig. 4.5: Charge state bins for each matrix rate. The shaded region shows the physically meaningful regime. The minimum of the shaded region is the charge which will give 2 mm deflection for the minimum energy in the energy range, and the maximum is the fully stripped charge for the ion. For energy range in the boxes with no shading the deflection is < 2 mm.
- PHA (Pulse Height Analysis) Data
A small sample of the raw events from the pre-processor board are added to the telemetry. The S3DPU adds two quantities to these events: the priority code and the spin sector in which the event occurred. In addition, it log compresses the energy and energy loss signals. The priority code indicates which range the event occurred in. The priority range boundaries correspond to the basic rate boundaries. In order to emphasize heavy ions in the transmitted data, the fraction of events from each range to be put into the telemetry can be specified. If there are not enough events of a high priority range to fill the available telemetry, it is filled by events of lower priority.
In order to emphasize data from the high resolution fan (fan 1) when it is available, the S3DPU checks the BH rate for fan 1. If it exceeds a programmable threshold, only PHA events from fan 1 are included in the PHA data. Otherwise, the PHA data comes from all fans. The final PHA events that are transmitted in science mode contain 48 bit as shown in Table 4.6.
Table 4.6: PHA events as transmitted into telemetry in science mode
|
Signal
|
Desciption
|
Quantity
|
Bits/item
|
|
E` + gain bit |
PC anode signal, log compressed |
1 |
10 |
| E + gain bit |
Peak energy from SSDs, log compressed |
1 |
11 |
| Z1-Z2 |
Angle in fan direction |
1 |
8 |
| Y |
Computed position in deflection direction |
1 |
10 |
| Fan ID |
Fan ID |
1 |
2 |
| SSD ID |
Identifies top or bottom half of fan |
1 |
1 |
| Priority |
Priority Code |
1 |
3 |
| Azimuth |
Sector in which event was measured |
1 |
3 |
| Total |
|
|
48 |
5. Calibration and Performance
The calibration of the SEPICA can be separated into the determination of the geometric factor, the evaluation of the charge resolution (separate for each fan), and the identification of elements and charge states to define the Matrix boxes in Figs. 4.3 and 4.4. The geometric factor of each fan is determined by the effective aperture area and the acceptance angle of the respective collimator and the transparency of any obstructing structure in the detector assemblies, such as grids and the proportional counter wires. Also the charge state resolution depends mainly on the geometry of the collimator. Therefore, these sensor attributes can be determined from a geometric characterization of the collimators, which has been performed before the fan integration activities. However, the element and charge state identification are properties of the entire sensor fan. Therefore, the latter activity was performed with complete fans or even the total sensor using a -sources and accelerator beams.
5.1 Geometric characterization of the collimators
Focal line width and throughput of the SEPICA collimators were verified in a series of optical tests. The focal line widths were measured with the full collimator illuminated. The focal line FWHMs for the three fans are 0.982 ± 0.007 mm, 3.23 ± 0.04 mm, and 3.47 ± 0.03 mm. Ideal per design values are 0.984 mm, 2.95 mm, and 2.95 mm, respectively. The slightly increased values for the focal line of fans 2 and 3 are probably due to taking the measurement below the focal line. Evaluation of data with partial illumination of the collimator showed a distinct separation of the respective focal line images. Because the collimators were already integrated at this time, the measurement could not be repeated. By comparing the centers of the focal line separately for the upper and lower half of the collimators it was verified that the two halves of the collimator are aligned to within 2.5 µm.
The collimator throughput was determined for the engineering model by a comparison of the light transmission through a single slit for a two plate collimator (entrance and exit only) with that through the full collimator assembly. Any misalignment due to tolerances reduces the transmission for the full collimator over the two plate assembly, which represents ideal transmission for the design geometry. Because this more precise method requires excessive handling of the collimator plates, the relative transmission of the flight collimators was verified by determining the reduction of the focal line width over the design geometry for several 5 mm  5 mm sample areas across the collimator. The square of the focal line width reduction is equivalent to the reduction in transmission, because both entrance aperture and acceptance angle are affected. For fan 1 an average transmission across the collimator area of 67±4%, close to the goal of 70% was found. This translates into a net geometric factor of 0.031 cm2 sr. For the other two fans, the transmission is consistent with a combined geometric factor of 0.20 cm2 sr. This value includes all reductions of the instrument detection efficiency due to collimator transmission and the transparency of the detector assemblies. The detection efficiency computed from the individual grid transparencies and the actual efficiency as derived from the comparison between the proportional counter trigger rate and the coincidence rate agree within the instrument accuracy.
The deflection in the electrostatic analyzer and position resolution of the collimator-analyzer system were tested with low (2 keV) ion beam. A microchannel plate imaging system was used for detection in the focal plane, and the deflection voltage was scaled to the lower energies. The deflection test was repeated in the full fan configuration with -particles from an Am 241 source. These measurements have verified that SEPICA deflects 1 MeV/Q ions by 10 mm with the full deflection voltage of 30 kV.
5.2 Calibration of the element and charge identification of SEPICA
The element identification in SEPICA is achieved in a E versus residual energy E parameter analysis of the sensor. While the energy response of SSDs is fixed by their charge conversion of 3 eV per e-ion pair, the E signal as measured by a PC depends on its geometry, the gas composition and density, as well as the electric field strength around the anode wires. In isobuthane the creation of an e-ion pair requires 23 eV. For nominal operation of the SEPICA fans with 20 Torr PC pressure at 25°C and an anode voltage of 1000 V a gas gain of 115 is achieved with a doubling of the signal for each additional 90 V. The electronic threshold for the E signal is set to 6 fC which is equivalent to an energy loss of 8 keV in the PC. This corresponds to the signal of a 3 MeV proton. The high gain section of the amplifier chain tops at 195 fC (equivalent to the maximum energy loss of He ions), while the low gain section extends to 4.27 pC thus including also 60 MeV Fe with the maximum energy loss in the operational regime.
Figure 5.1 shows a sample of calibration data taken at the Brookhaven National Lab (BNL) with a 20 MeV Fe beam. Both element identification capability from dE/dx versus E and charge resolution from ion deflection are illustrated. The FWHM of the dE/dx distribution is 10% and for residual energy 8%. Some events are found along a line towards lower dE/dx and E and a line at constant dE/dx. The first group probably has lost energy at the support grid of the entrance window and thus falls on the Fe track at lower energies, while the latter group must have lost energy after passing the PC. The event groups with E = 0 mark ions that were stopped in one of the grids or wire planes of the PC and thus were degraded in E and/or dE/dx. The relatively wide foot in energy may be attributed to the large energy loss and straggling experienced by 0.36 MeV/Nuc Fe ions. The lower right panel of Fig. 5.1 demonstrates the position resolution and ion deflection in a comparison of two measurements with 11.5 kV and 0 kV deflection voltage applied. The undeflected focal line is at the nominal Y position of 5 mm, while an additional deflection of 2 mm is achieved in the 11.5 kV run. The result is compatible with the beam charge state of 10 to 11 and a slightly less than 1 mm wide focal line in the PC.
Fig. 5.1: Sample calibration measurement as taken with the SEPICA spare fan at BNL with a 20 MeV Fe beam at 11.5 kV deflection voltage. A dE/dx versus E chart is shown in the upper left along with the corresponding dE/dx and E spectra to its right and bottom. The fourth panel on the lower right shows the deflection of the ions in comparison with the deflection voltage turned off.
The element resolution of SEPICA and the actual position of the element tracks for the calibration of the Matrix Rate boxes as shown in Fig. 4.3 are demonstrated for in-flight operation from the strong solar flare on November 5, 1997, in Fig. 5.2. SEPICA can indeed resolve individual elements up to Ne and provides a good resolution of the major ion groups up to Fe. The long term behavior of the inflight calibration can be monitored through three Am 241 -sources with 50 µCi activity, one in each sensor fan. The calibration -particles are directed into the low energy part of the detector in order to avoid interference with the natural He population. The stability of the electronics is monitored separately through a self-stimulation sequence that can be initiated by telecommand.
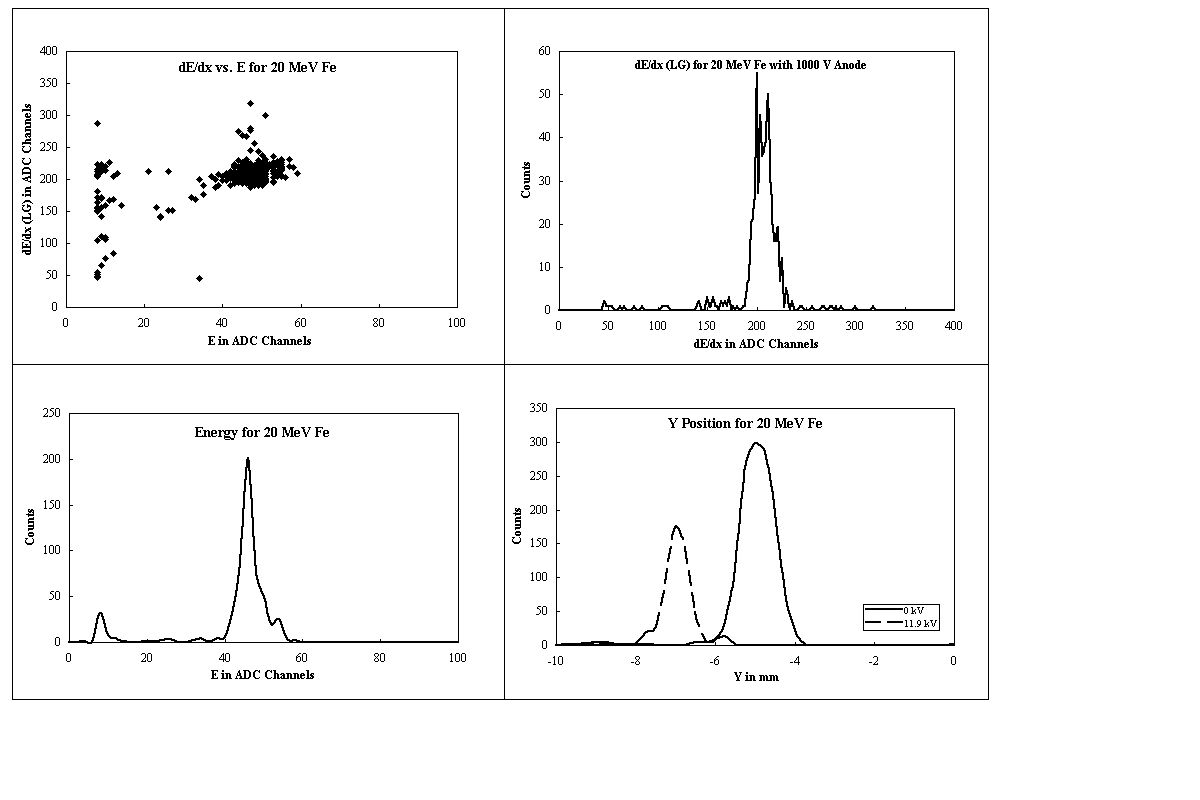

Fig. 5.2: Color coded pulse height event matrix in energy loss ( E) versus residual energy (Eres) for one of data from fan 1 of SEPICA during a solar flare on November 7, 1997. The tracks for the different elements are clearly separated. Hydrogen events have been taken out during the data processing to reduce the dynamic range in total counts for the display.
6. Supporting Subsystems
The functionality of the SEPICA instrument is not only based on the sensor performance and the processing electronics, it also requires the trouble-free operation of sophisticated support systems, such as high voltage supplies for the deflection unit, PCs and SSDs, as well as a gas flow control system for the three PCs. These subsystems, which required a high design effort, are described below. The power distribution into subsystems is compiled in Table 6.1.
Table 6.1: Power as used by subsystem
|
Subsystem
|
Average Power (W)
|
Peak Power (W)
|
| Detectors |
6.93 |
6.93 |
| E-Box |
7.71 |
8.71 |
| Gas Regulation |
0.36 |
0.36 |
| 30 kV Supply |
1.50 |
1.50 |
| Totals |
16.5 |
17.5 |
6.1 Deflection HV Supply
The deflection HV supply will provide a positive HV up to 30 kV to each of the positive deflection plates in the electrostatic analyzers. The 30 kV power supply consists of an amplitude controlled oscillator and a Cockroft-Walton multiplier. The voltage available to the bottom of the voltage multiplier can be varied from zero to 2000 V peak by comparing an input analog command with feedback from the high voltage and using the error signal to control the current in the oscillator. A hard limit is set at 2000 V peak by the DC power supply to the oscillator. The multiplier consists of 35 stages which allow the output voltage to reach about 36 kV.
The power supply is divided into two cavities, one with the low voltage circuits up to the output transformer, the other with the voltage multiplier and the 5000 M feedback resistors. The low voltage circuitry is packaged in a standard printed wire board, the transformer is mounted on the metallic housing, and the high voltage output wire is routed very carefully to minimize the danger of discharges. The voltage multiplier is subdivided into seven circular printed wire boards each with five stages of multiplication and a metal shield ring around the circumfer ence that provides a low electric field environment on the board and shapes the field between the electronics and the housing. The boards have a center hole and are mounted on an Ultem tube that contains the high voltage feedback resistors. Short tubes of silicon nitride are used to set the spacing between the boards and to provide a low thermal resistance to the metal housing at the bottom of the structure. There is an insulating sleeve of fiberglass inside the external aluminum cylindrical housing. The high voltage end is capped by a field shaping torus and supported through an Ultem end piece. The output is through high voltage cables, with their metal shield terminated on the metal housing and the center wire and insulation extending through the Ultem support to the center of the torus. Here the connections are made by means of pin and socket in a low field region. A view of the open HV supply is shown in Fig. 6.1.
The electric field distribution in the high voltage section was studied and optimized throughout the design phase using the ELECTRO simulation program by Integrated Engineering Software. The engineering model supply was tested up to 40 kV by raising the input voltage supply beyond the specified value. It was operated for 400 hours at 36 kV for flight qualification.
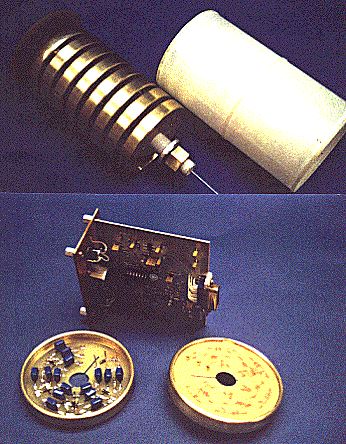
Fig. 6.1: 30 kV HV supply, interior of multiplier assembly and insulation insert (top), driver board and individual multiplier stage (bottom).
6.2 Proportional Counter Bias Supply
The PC bias supply provides a positive high voltage for each of the three PCs, which can be commanded separately with 8 bit resolution up to 2.5 kV. The effective source resistor of each of the three outputs is 500 M and provides sufficient safeguard for each of the PCs. The high voltage of the Cockroft-Walton multiplier stack is determined and loop controlled by the highest set value. The individual output voltages for the three PCs are independently controlled and regulated by separate feedback loops with high voltage opto couplers. In case of a failure in one of the PCs, the corresponding bias voltage can be switched off by setting its command value to zero. This approach saves mass, power and space. The Cockroft-Walton multiplier stack consists of five stages. The opto couplers are customized assemblies of a transparent high voltage diode and four IR-LEDs completely enclosed with an optically transparent potting material.
6.3 Solid State Detector Bias Supply
The SSDs are biased with a negative voltage up to -75 V, which is provided by a single transformer. The primary side of the transformer is fed with a feedback loop controlled AC voltage. The secondary transformer output is rectified and separately supplied over a 100 k filtering network to each of the six SSDs. The actual bias voltage can be set with 8 bit resolution up to 75 V.
6.4 Gas Regulation System
The SEPICA gas regulation system controls the flow of isobutane gas through each of the 210 cm3 PC volumes for all three fans to maintain a fixed gas density. The PCs are operated in a flow-through mode in order to keep them supplied with fresh gas. This minimizes the build-up of cracked hydrocarbons on the counter wires. Therefore, the counter gas pressure is balanced against a calibrated precision orifice, which provides a gas flow of 0.75 cm3/min at a PC pressure of 20 Torr. In essence the control system is referenced to a pressure set value that is adjusted internally for constant gas density according to the sensor temperature as measured by a thermis tor. With the combined outflow rates of all three fans the SEPICA gas supply will be sufficient for full operation over more than 6 years.
- Description of the gas regulation
A schematic overview of the gas system is shown in the blockdiagram in Fig. 6.2. The regulation of the gas flow is accomplished individually for each PC by using a membrane pressure transducer and a micro-machined bi-metallic silicone valve by IC Sensors, Milpitas, CA. The voltage output from the pressure transducer is compared with a value set by the S3DPU based on telecommand and sensor temperature. The control loop of the system uses pulse width modulation for the on time of the valve to adjust the pressure to the preset value. Each proportional counter is serviced by the system in sequence, i.e. the maximum on-time for each PC can be one third of the time. After a maximum on-time of 9 sec the gas control will time out and automatically shut off the gas, unless the set value has been reached before that time or the S3DPU issues an overriding "off" command. The maximum on-time is used during the initial filling of the PCs. During nominal operation the fill intervals typically last 100 - 400 msec.
The regulation band for the gas pressure is ± 1% and can be set by command through the S3DPU to any value between 10 and 30 Torr. Nominal operation is anticipated at 20 Torr. Gas regulation of 1% precision is assured with a 10 bit ADC. The control algorithm and additional safety functions are implemented in an Actel gate array.
The gas regulation works off a supply pressure of 250 Torr. Preregulation of the gas pressure from the tank, which is at the isobutane vapor pressure, is achieved with a mechanical pressure reducing valve. A fourth pressure transducer monitors the preregulated gas at 250 Torr which feeds the three gas regulation valves. During launch the tank volume is sealed by a magnetic latch valve that is controlled by spacecraft command.
- System Safeguards
During the ascent of the spacecraft through the atmosphere all three counter systems are open to the outside through a baro switch that closes at an outside pressure of 60 Torr. In this way the integrity of the PC windows is assured. The remainder of the air trapped in the counter volume will then bleed slowly through the precision orifice.
During instrument operation the PC gas pressure and the valve on-times will be continuously monitored by the S3DPU. If the gas pressure is too high or too low, or if the gas valve on-time is too long, the S3DPU will automatically take corrective action without human intervention. In case of an overpressure, the corresponding regulation valve will be power-cycled with a pulse of full power automatically, which is a known cure in case a valve stays open after an excessive temperature swing. In case of an underpressure the corresponding regulation valve will be shut-off and the PC HV for this unit will be disabled to avoid damage of the PC. In all cases an over- or underpressure alarm will be set in the telemetry.
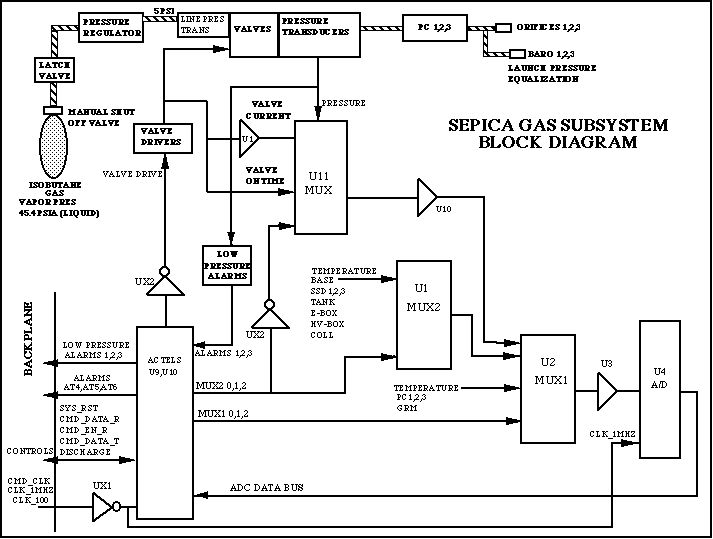
Fig. 6.2: Block diagram of SEPICA gas flow control.
7. Structural Design and Packaging
SEPICA is a modular instrument with 3 distinct sensor fans, an isobutane gas supply and regulation system, a 30 kV high voltage supply, an electronics box and a passive thermal radiator all tied to a common base plate. This modular design allows independent assembly, testing and integration of each Fan and supporting subsystem with minimal impact on the balance of the instrument. All subsystems are through bolted to the base plate. SEPICA weighs 37.4 kg ready for launch with basic outline dimensions of 71 cm x 46 cm and 53 cm height. The mass distribution according to subsystems is compiled in Table 7.1.
The bulk of the SEPICA structure is aluminum, with alloy 6061 used in low stress areas, and alloys 7075 and 2219 used in higher stress parts such as the base plate, or in elaborate parts requiring precise flatness and tolerance control such as the collimator mounting and spacer plates as well as the radiator. A limited supply of magnesium AZ-31B plate is used in the collimator spacer plates and some of the structure for mass reduction purposes. As a high electrical performance, low outgassing material Ultem 1000 polyetherimide is used for electrical and HV insulation in the detector assembly and the 30 kV HV supply. Macor machineable ceramic is utilized for the proportional counter cathode and anode plates. The isobutane tank is a carbon fiber over-wrapped aluminum vessel, custom fabricated for this application.
The ACE spacecraft mechanical interface is through 10 mounting lugs with titanium 1/4"-28 aerospace quality socket head cap screws, and upper/lower Ultem 1000 thermal isolation bushings. These high strength fasteners are torqued to 11 Nm, thus providing adequate compression to avoid slippage between the deck and bushings. All electrical interface harnesses connect with SEPICA at the instrument electronics box via standard D-sub-miniature connectors. In addition, two sets of 3/16" Teflon tubing lines run bundled into a spacecraft harness. One set is utilized to purge the SEPICA detectors with dry nitrogen during integration and testing and the other one to carry the isobutane gas, that is vented from the proportional counters, away from the spacecraft.
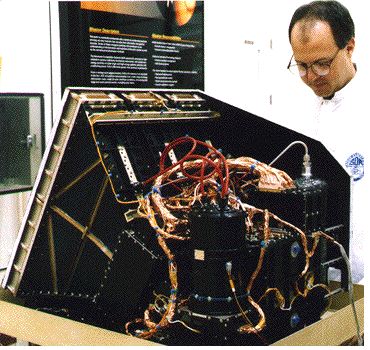
Fig. 7.1: Complete SEPICA sensor seen from the rear side.
Table 7.1: Mass distributed by subsystem
| Subsystem |
Mass (kg.) |
| HV Supply & Dist. Cables |
1.7 |
| Gas Supply System |
1.9 |
| Gas Dist. & Regulation |
3.7 |
| Fan Assemblies(3) |
18.7 |
| Base Plate & Brackets |
4.9 |
| Thermal Items/Radiators |
1.6 |
| E-Box |
4.9 |
| Total |
37.4 |
8. Thermal Control
SEPICA is thermally controlled via radiative dissipation to space. The instrument is conductively isolated from the spacecraft deck by Ultem in order to minimize spacecraft dissipation requirements. The resulting thermal resistance to the deck is 15°C/W. A 1000 cm2 passive radiator mounted on the starboard side of SEPICA, covered with silver Teflon film, provides the necessary radiative shunt. Other than the instrument aperture and the radiator, the balance of SEPICA is covered with multi-layer insulation blankets. The preferred operational thermal range for the bulk of SEPICA is -10°C to +40°C, which brackets the demonstrated cold and hot case limits for the detectors on the spacecraft of +5.8°C and +39.5°C. The thermal constraints of all essential subsystems are compiled in Table 8.1
Table 8.1: Temperature limits for each subsystem
| Subsystem |
In Spec. Operating |
Design/Test Limits |
No-Op. Survival |
| Detectors |
-15 to +35°C |
-20 to +45°C |
-20 to +60°C |
| Electronics |
-15 to +60°C |
-25 to +70°C |
-25 to +75°C |
| 30 kV Supply |
-15 to +55°C |
-25 to +65°C |
-25 to +70°C |
| Gas Supply Tank |
-15 to +40°C |
-20 to +50°C |
-25 to +60°C |
| Gas Regulation |
-10 to +40°C |
-20 to +50°C |
-20 to +60°C |
**SEPICA requires 2 W of operational heater power to maintain the gas regulation subsystem within its in-spec. operating limits. Additionally, SEPICA requires 8 W of survival heater power to maintain the non-operating limits.
The SEPICA instrument electronics and power supplies dissipate approximately 16.5 W average during normal operation. All instrument subsystems are surface treated with high e , black anodize hard coat for optimal emittance into the cavity under the blanket, and eventually to the back of the radiator. The aperture (collimator) plates are coated with Goddard Composite Coating (GCC), a unique high  , low vacuum deposited film, intended to minimize solar heating effects. Thermal baffles between the three detector apertures and forward edge of the radiator are also covered with silver Teflon.
A thermostatically actuated operational heater circuit of 2 W is provided on the isobutane gas regulation module to protect the regulation transducers from low temperature extremes (below 0°C). An 8 W survival heater circuit is provided on the instrument electronics box in the event of an extreme cold temperature turn-on or other casualty. The survival heater has been demonstrated to maintain the SEPICA cavity temperature to an average of +17°C.
9. Common Data Processing Unit (S3DPU) for SWICS, SWIMS and SEPICA
Three of the ACE-sensors, SWICS, SWIMS and SEPICA, are served by one common data processing unit, whose heritage goes back to the DPUs for AMPTE-CHEM, Ulysses-SWICS, PHOBOS-SOWICOMS, Geotail-EPIC and SOHO-CELIAS, which have been designed and implemented by the Technical University Braunschweig, Germany. The S3DPU is a direct derivative of the SOHO-CELIAS DPU (Hovestadt et al., 1995). A common characteristic of this DPU family is an event driven, table-oriented fast preprocessor for classification and priority identification, that is very flexible and can serve a variety of different sensors with identical hardware. The general hardware and software functions as well as the design philosophy of the S3DPU are described in the following section, while the data structure and the scientific contents are discussed in conjunction with the individual sensors. For SEPICA the data flow from the sensor to the spacecraft has been described in section 4. of this paper. The corresponding description for SWICS and SWIMS may be found in the paper by Gloeckler et al. (1998) in this volume.
9.1 Tasks and General Structure The S3DPU has been designed to perform the following tasks: 1. Pathlength correction for passage through the electrostatic analyzer and the proportional counter (PC) according to the impact positions in the PC and the solid state detectors for SEPICA; 2. Classification of pulse height analysis (PHA) events into: - a two dimensional M versus M/Q matrix for SWICS - a one dimensional M vector for SWIMS and accumulate them separately into Matrix Rates (with low resolution in matrix space, energy separation and high time resolution) and into Matrix Elements (with high resolution in matrix space, energy integrated and low time resolution) - two-dimensional Z versus Q Matrix Rates for SEPICA; 3. Prioritization of PHA events from each sensor according to a predefined scheme and insertion of these events into the PHA section of the Experiment Data Blocks; 4. Formatting and transfer of the Experiment Data Block into the spacecraft telemetry; 5. Receiving, decoding and execution of memory load commands; 6. Control of the deflection voltage stepping according to a predetermined scheme for SWICS and SWIMS; 7. Automated control of the sensor status and the reconfigurable S3DPU parts that can also be altered or initiated by telecommand; 8. Initialization of the S3DPU program after a latch-up induced power down period; 9. Monitoring of the housekeeping (HK) values for the S3DPU and the sensors with autonomous reaction on out-of-spec values for critical items, such as HV and gas pressure; 10. Execution of preprogrammed inflight calibration cycles for each sensor on telemetry request (sequences with different Inflight Calibration commands, various settings of the stimulation DACs for all sensor elements are stored in the S3DPU); The S3DPU architecture is structured into three levels as shown in Fig. 9.1: 1. The heart of the S3DPU is a dual redundant microprocessor system (80C86) with a dual redundant S/C interface, including redundant power supply and watch-dog circuitry. 2. To connect to the three sensors there are three hardware-identical Sensor Interfaces (SIF). 3. Finally, there are three hardware-identical Classification Units (CLU). Both, SIFs and CLUs, can be configured by the micro-processor system for any sensor.
The level (1) processing (core software) is sequenced by a tailored Real Time Operating System, which responds to interrupts (from the spacecraft interface, the CLUs, the watch-dog circuitry and the latch-up protection circuitry) according to a priority scheme. The sequencing of level (2) and (3) processing is event driven. Within level (3) each of the three CLUs can be allocated to each SIF. This switching is supported by serial data transmission from the SIFs to the CLUs. If one or even two of the CLUs should fail, the remaining ones will be shared by all three sensors according to a preprogrammed or commanded stepping scheme.
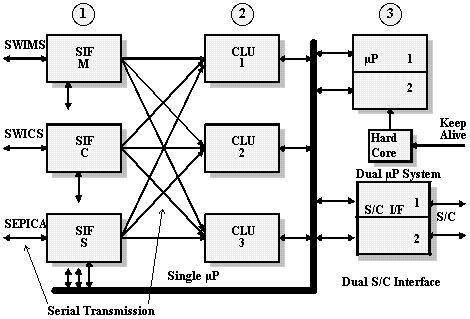
Fig. 9.1: Schematic block diagram of the S3DPU.
9.2 Sensor Interfaces
Figure 9.2 shows the SIFs in more detail. The electronics of each individual sensor and the SIFs communicate through serial transmission via balanced twisted pair lines. Accidental high voltage surges, that may enter the SIFs as a common mode signal, are rejected by balloon ring coils. The SIFs comprise all the preprocessing of sensor data, which cannot be handled by the identical CLUs. The amount of these dedicated preprocessing tasks increases in the order SWICS, SEPICA, SWIMS. In order to conform with the heritage SIF from SOHO a special preprocessor board has been included in the SEPICA sensor electronics as described in section 4. The maximum event rates of 20 kHz (SWIMS), 20 kHz (SWICS) and 10 kHz (SEPICA) result in maximum output rates of approximately 1 Mbps (SIF-M) and approximately 0.5 Mbps, (SIF-C, SIF-S), respectively.
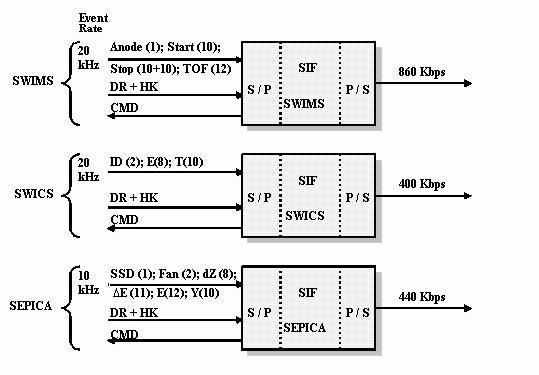
Fig. 9.2: Block diagram, data structure and rates for the three sensor interfaces of the S3DPU.
9.3 Classification Units
In the classification units the incoming particles are sorted according to their relevant parameters which then allows separate onboard accumulation. With SEPICA the energy loss (E) in the PC, the residual energy (ERes) after passing the PC, and the deflection (y) in the known electric field of the electrostatic analyzer are measured to determine the element (Z), energy (E), and ionic charge (Q) of each particle, as described above. SWIMS measures the time-of-flight ( ) in a retarding harmonic potential which determines the mass/charge (M/Q) of the particle with high precision. In addition, the energy/charge (E/Q) is recorded. In SWICS the original energy/charge (E/Q) of the incoming particle as well as its time-of-flight () and residual energy (ERes) after post-acceleration by the voltage Uacc are measured. From these quantities the mass (M) and mass/ionic charge (M/Q) are derived and recorded together with the original E/Q of each particle. For all three instruments the derived quantities form the basis for their classification.
To illustrate the classification scheme we take SWICS
as an example. The actual relations (Gloeckler et al., 1998)
M = (E, M) ·
2 · ERes (9.1) M/Q = (E, M) ·
2 · (E/Q + Uacc (9.2)
relate the measured quantities E/Q, , and ERes to the mass (M) and mass/charge (M/Q) of the incoming ions. The species and energy dependent parameters and describe the energy loss in the entrance foil of the time-of-flight sensor and the energy defect in the solid state detectors, respectively. Relations (9.1) and (9.2) are modeled by power series expressions
ln M = b0 + b1 * v + b2 * u + b3 * u * v + b4 * v2 + b5 * u3 (9.3) ln M/Q = a0 + a1 * u + a2 * u4 (9.4) a0 = A00 + A01 * w + A02 * w2 a1 = A10 + A11 * w + A12 * w2 a2 = A20 + A21 * w + A22 * w2
where u = ln (/ns); v = ln (ERes/keV); w = ln ( (E/Q + Uacc)/kV ). The coefficients represent sensor parameters that are determined by the sensor calibrations. With the appropriate modifications similar relations can be applied to other sensors with a three-parameter measurement. In this way the example described above is generic for all sensors that are supported by the S3DPU.
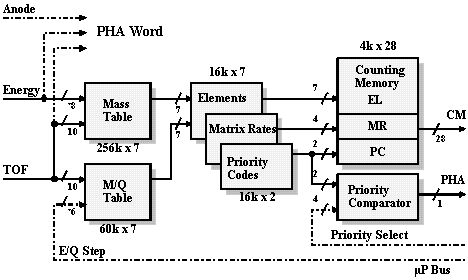
Fig. 9.3: Flow diagram of the CLU coding for SWICS as an example.
In case of low event rates up to 1 kHz a numerical calculation of these relations can be performed by a standard microprocessor. Such a software-based approach has been applied, e.g., to the energetic particle and ion composition instrument on Geotail (Williams et al., 1994). Higher event rates call for a table-based evaluation within a dedicated preprocessor. For illustration purposes Fig. 9.3 shows a straight-forward implementation as a hardwired two-stage pipeline of fixed-sized tables. The two-dimensional table of 28 entries in energy and 210 entries in time-of-flight delivers a seven-bit value for M = f (E, ). Correspondingly, the two-dimensional table of 210 entries in time-of-flight and 27 entries in energy per charge delivers a seven-bit value for M/Q. The combination of both table outputs defines one out of 214 fine resolution bins within the M-M/Q-plane. The three channel (M, M/Q, E/Q) address tables in the second pipeline stage compact a set of adjacent fine resolution bins into an accumulation channel into either a Matrix Rate, a Matrix Element, or a Priority Class for PHA events. The E/Q entry of the M/Q table is constant over the period of each deflection voltage step, generally one spacecraft spin. Therefore, the size of the M/Q-table can be reduced to 1K x 7 by loading only the valid table section for each E/Q step, provided the entire table is stored within additional random access memory (RAM).
At the extreme end of the implementation a task specific hardwired pipeline structure can support very high event rates (up to several 106 events/s), but at the expense of flexibility. For medium event rates (104 - 105 events/s) the tables may be accessed in sequence. A compromise of five subsequent steps has been chosen for the S3DPU. The transition from parallel to sequential table access leads to a very flexible approach that is characterized by a large uniform address space and by mapping of the data flow diagram into a RAM-controlled state machine, which executes the various table operations step by step. Then the number of tables, their size and the interconnection scheme can be configured in software. In this way the table contents are also configurable. Thus the processor can individualize the CLU for each sensor.
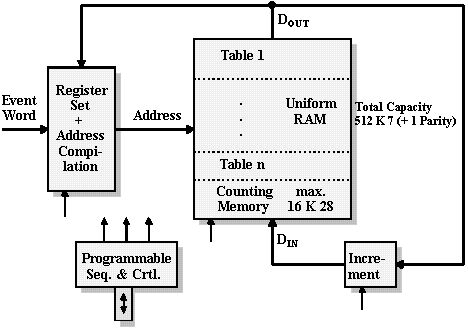
Fig. 9.4: Flow diagram of a typical classification software architecture along with the allocation of memory space to the relevant classification tables.
The RAM address space of the S3DPU CLUs can be configured into nine tables plus counting channels as seen in Fig. 9.4. Typically, an individual table lookup returns another address, which after appropriate modification, e.g. by adding a base address, represents the pointer for the subsequent table access. The final result is the pointer to the counting channels to be incremented (up to three in our example). The contents of the tables is routinely calculated and transferred into the table locations by the active processor. Computation algorithms and coefficients are stored in the micro-processor software. These EPROM-stored coefficients can be modified via telecommand. In this way adjustments or even substantial adaptations to the algorithms can be implemented during the mission.
In addition to the two-dimensional matrix spectra, PHA-words of selected events are inserted into the experiment data frame. A priority code that biases against the most abundant species, such as H and He, is assigned to each event. This priority scheme is based on the same classification algorithm as the matrix elements, but with a much coarser resolution. For each PHA event the resulting priority code is compared with a priority select mask that is computed by the processor based on previous events. If the priority of the current PHA event is accepted, the event is read and added to the data block. The detailed requirements for the matrices and the PHA event processing are described for SEPICA in chapter 4. The corresponding information for SWICS and SWIMS can be found in the paper by Gloeckler et al. (1998).
9.4 Data Validation and Redundancy Concepts
The S3DPU presents a potential single-point failure for three instruments and therefore has to be inherently reliable. Therefore, great care has been taken to avoid single point failures in the S3DPU and to allow sharing of identical multiple hardware as much as possible. In particular, the S3DPU contains a dual redundant processor system. All core hardware that supports the basic operating system is dual redundant with the exception of the bus system. This concept includes a dual redundant spacecraft interface and a dual redundant power converter. Selection of the interface is controlled by a flip-flop, which toggles automatically with each power cycle of the S3DPU. The processor can be selected by toggling a selection flip-flop via a specific pulse command issued by the spacecraft. The flip-flops belong to the minimum core hardware and are powered by a keep-alive-line from the spacecraft. A high degree of redundancy is achieved for the three identical CLUs by cross-strapping. If one or even two CLUs should fail, the remaining CLUs can be shared by all three sensors according to a cyclic automatic reconfiguration scheme. In case of the failure of one of the sensors, the CLUs can be configured such that the data stream will be completely filled with data from the remaining active sensors.
The S3DPU is equipped with protection switches against latch-up through penetrating radiation. The S3DPU circuitry is subdivided into eight independent supply partitions. If a partition-individual threshold for the supply current is exceeded, the S3DPU is shut down completely, with the exception of the status memory and some status flip-flops. This core hardware is then powered by the keep-alive voltage. After a short delay time of 5 s the central switch will be closed again, and the S3DPU is reinitialized. Since the current of the partitions varies substantially with the activity, a single threshold would have to be set so high that even a sub-threshold latch-up current could overheat a device after some time. Therefore, two thresholds are monitored separately, a high threshold during regular S3DPU operation and a low threshold every 156 ms within a short time window of 1 ms, when the S3DPU is driven into a sleeping state.
Great care has been taken with the software to run the unit inherently reliable and to ensure data integrity. The software is protected by hamming single error correction (SEC) for both the processor-RAM and -EPROM. For example, single event upset (SEU) induced bit flips are corrected automatically by a SEC coder/decoder hardware in the S3DPU. The parity bit protection is extended to the CLU table RAM in order to avoid SEU induced misclassifications. In addition, the table contents are routinely refreshed by recalculation from the stored parameter set.
9.5 Packaging
The S3DPU is built in classic card-cage technique. A stack of nine multilayer daughter boards is interconnected by a multilayer motherboard with flexible extensions to all box connectors. The box walls have been designed to a thickness of 3 mm Al in order to provide sufficient shielding for the high-density standard RAM/EPROM devices within the CLUs and the microprocessor-systems, whose tolerance dose is approximately 15 krad. The S3DPU weighs 3.9 kg, uses 3.0 W on average (4.0 W peak) and can operate within -55°C and +85°C.
Acknowledgements
The investigators gratefully acknowledge the enthusiastic support with contracts, rush purchasing and accounting by the staff of the Space Science Center Jeanne Bartlett, Susan Roy, and Pat Stevenson as well as the dedicated day-to-day assistance by Phyllis Kelly and Robin Pendexter. They wish to include in their thanks to the many unnamed individuals at the hardware contributing institutions. Four test and calibration campaigns at Brookhaven National Lab were made a success due to the help by Charles W. Carlson and his team. We also like say special thanks personnel of the Goddard Space Flight Center test facilities who went to great lengths to help SEPICA in the end game. In addition, we we would like to extend special thanks to the ACE Payload Management Office under Al Frandsen and the Explorer Project Office under Don Margolies for their continued assistance to keep the instrument implementation effort on track.
The University of New Hampshire would like to extend special thanks to the following people and their corporations. The expertise and dedication they brought to the project helped make SEPICA become a true technological achievement for all involved. In no special order we thank: Mark Amrich, Thermo Electron (Tecomet), for the fabrication of the photo-etched collimator plates; Forbes Powell, Luxel Corp., for the fabrication of the proportional counter polyimide windows; Paul Burger, Canberra Semiconductor, for the fabrication of the Solid State Detectors; Hal Jerman, IC Sensors, for the fabrication of the micro-machined silicon regulation valves; Dave Broderick, Ceramic-to-Metal Seals, for the development and fabrication of the proportional counter anode and cathode plates; Dave Ferguson, MOOG Space Products Division, for the fab rication of the main isobutane gas latch valve and regulator; Aleck Papanicolopoulos, Structural Composite Industries, for the fabrication of the Isobutane tank; Jennifer Molin, Northeast EDM, for the fabrication of the collimator spacer plates; Steve Dunham, Dunham Engineering, for the design effort with the collimator assembly. Other notable companies with major contributions to SEPICA are Stone Machine, American Electroplating, Seacoast Machine, Bicron, AOTCO Metal Finishing, Janco P/C, Eastern Manufacturing Corp., Sovereign Circuits, Lockheed Sanders, Assurance Technology Corp., Plating for Electronics.
Without the continued help and dedication of all these institutions, companies and the many individuals this instrument would not have been possible. The design, fabrication and testing effort for SEPICA was supported under NASA Contract #NAS5-32626 to the California Institute of Technology through subcontract # PC112778 to the University of New Hampshire.
References
Arnaud, M., R. Rothenflug, Astron. Astrophys. Suppl. Ser., 60, 425, 1985.
Baker, D.N., G.M. Mason, O. Figueroa, G. Colon, J.G. Watzin, and R.M. Aleman, An Overview of the Solar, Anomalous, and Magnetospheric Particle Explorer Mission, IEEE Trans. on Geosci. and Remote Sens., 31, 531 - 541, 1993.
Fisk, L.A., B. Kozlovsky, and R. Ramaty, An Interpretation of the Observed Oxygen and Nitrogen Enhancements in Low-Energy Cosmic Rays, Ap. J. Letters, 190, L39, 1974.
Gloeckler, G., J. Geiss, E.C. Roelof, L.A. Fisk, F.M. Ipavich, K. Ogilvie, L.J. Lanzarotti, R. von Steiger, B. Wilken, J. Geophys. Res., 99, 17637, 1994.
Gloeckler, G., P. Bedini, P. Bochsler, L.A. Fisk, J. Geiss, F.M. Ipavich, J. Cain, J. Fischer, R. Kallenbach, J. Miller, O. Tums, R. Winner, Investigation of the Composition of Solar Wind and Interstellar Matter Using Solar Wind and Pickup Ion Measurements with SWICS and SWIMS on the ACE Spacecraft, Space Science Reviews, this issue, 1998.
Hovestadt, D., et al., The Nuclear and Ionic Charge Distribution Particle Experiments on the ISEE-1 and ISEE-C Spacecraft, IEEE Trans. Geosci. El., GE-16, 166, 1978.
Hovestadt, D., G. Gloeckler, H. Höfner, B. Klecker, C.Y. Fan, L.A. Fisk, F.M. Ipavich, J.J. O`Gallagher and M. Scholer, Direct Observation of Charge State Abundances of Energetic He, C, O, and Fe Emitted in Solar Flares, Adv Space Res., 1, 61, 1981.
Hovestadt, D., B. Klecker, H. Höfner, M. Scholer, G. Gloeckler and F.M. Ipavich, Ionic Charge State Distribution of Helium, Carbon, Oxygen, and Iron in an Energetic Storm Particle Enhancement, Ap. J. Letters, 258, L57, 1982.
Hovestadt, D., G. Gloeckler , B. Klecker and M. Scholer, Ionic Charge State Measurements During He+-rich Solar Energetic Particle Events, Ap. J., 281, 463, 1984.
Hovestadt, D., et al., CELIAS - Charge, Element and Isotope Analysis System for SOHO, in: The SOHO Mission, Solar Phys., 162, 441 - 481, 1995.
Jokipii, J.R., Particle Acceleration at the Termination Shock 1. Applications to the Solar Wind and the Anomalous Component, J. Geophys. Res., 91, 2929, 1986.
Klecker, B., D. Hovestadt, G. Gloeckler, F.M. Ipavich, M. Scholer, C.Y. Fan, and L.A. Fisk, Direct Determination of the Ionic Charge Distribution of Helium and Iron in 3He-rich Solar Energetic Particle Events, Ap. J. 281, 458, 1984.
Klecker, B., et al., HILT: A Heavy Ion Large Area Proportional Counter Telescope for Solar and Anomalous Cosmic Rays, IEEE Trans. on Geosci. and Remote Sens., 31, 542 - 548, 1993.
Klecker, B., et al., Charge states of anomalous cosmic-ray nitrogen, oxygen, and neon: SAMPEX observations`, Ap. J. Letters, 442, L69, 1995.
Luhn, A., B. Klecker, D. Hovestadt, G. Gloeckler, F.M Ipavich, M. Scholer, C.Y Fan and L.A Fisk, Ionic Charge States of N, Ne, Mg, Si, and S in Solar Energetic Particle Events, Adv. Space Res., 4, 161, 1984.
Luhn, A., B. Klecker, D. Hovestadt, and E. Möbius, The Mean Ionic Charge of Silicon in 3He-Rich Solar Flares, Ap. J., 317, 951, 1987.
Lutz, G. , W. Buttler, H. Bergmann, P. Holl, B.J. Hosticka, P.F. Manfredi, G. Zimmer, Low Noise Monolithic Front End Electronics, MPI-PAE Report, Exp. El. 170, 1987.
Mason, G.M., et al., The Solar, Anomalous, and Magnetospheric Particle Explorer (SAMPEX), Adv. of Space Sci., 1991.
Mason, G.M., D.V. Reames, B. Klecker, D. Hovestadt, and T.T. von Rosenvinge, The Heavy Compositional Signature in 3He Solar Particle Events, Ap. J., 303, 849, 1986.
Möbius, E., D. Hovestadt, B. Klecker, M. Scholer, G. Gloeckler and F. M. Ipavich, Direct observation of He + pick-up ions of interstellar origin in the solar wind, Nature, 318, 426, 1985.
Mullan, D.J. and W.L. Waldron, Ionic Charge States of Solar Energetic Particles: Effects of Flare X-Rays, Ap. J. Letters, 308, L21, 1986.
Pfeffermann, E., et al., The Focal Plane Instrumentation of the ROSAT Telescope, SPIE 733, 519, 1987.
Reames, D.V., Energetic Particles from impulsive Solar Flares, Ap. J. Supp., 73, 235, 1990.
Reames, D.V., Particle Acceleration in Solar Flares: Observations,
in: Particle Acceleration in Cosmic Plasmas, G.P. Zank, T.K. Gaisser eds., AIP Conf. Proc. 264, 213 - 222, 1992.
Stone, E.C., A.M. Frandsen, R.A. Mewaldt, E.R. Christian, D. Margolies, J.F. Ormes, F. Snow, The Advanced Composition Explorer, Space Science Reviews, this issue, 1998a.
Stone, E.C., C.M.S. Cohen, W.R. Cook, A.C. Cummings, B. Gauld, B. Kecman, R.A. Leske, R.A. Mewaldt, M.R. Thayer, R.L., Dougherty, R.L., Grumm, B.D. Milliken, R.G., Radocinski, M.E. Wiedenbeck, E.R. Christian, S. Shurman, T.T. von Rosenvinge, The Solar Isotope Spectrometer (SIS), Space Science Reviews, this issue, 1998b.
Stone, E.C., C.M.S. Cohen, W.R. Cook, A.C. Cummings, B. Gauld, B. Kecman, R.A. Leske, R.A. Mewaldt, M.R. Thayer, R.L., Dougherty, R.L., Grumm, B.D. Milliken, R.G., Radocinski, M.E. Wiedenbeck, E.R. Christian, S. Shurman, S. Trexel, T.T. von Rosenvinge, W.R. Binns, P. Dowkonn, J. Epstein, P.L. Hink, J. Klarmann, M. Eijowski, M.A. Oletich, The Cosmic Ray Isotope Spectrometer (CRIS), Space Science Reviews, this issue, 1998c.
Va`vra, J., Review of wire chamber aging, Proc.of Wire Chamber Conf., Vienna, 1986.
Williams, D.R., R.W. McEntire, C. Schlemm II, A.T.Y. Lui, G. Gloeckler, S.P. Christon, F. Gliem, Geotail Energetic Particles and Ion Composition Instrument, J. Geomag. Geoelectr., 46, 39, 1994.